The deformation behavior of materials is often time dependent. During uniaxial mechanical testing at higher deformations speeds, most metals display higher strengths. This time dependence is called strain rate sensitivity, and it is an important factor to consider in nanoindentation testing, as well. In this application note, we discuss the relationship between indentation test profiles and the resulting measured hardness values, and we demonstrate techniques for measuring strain rate sensitivity using constant strain rate and strain rate jump indentation. We show that displacement control and continuous stiffness measurement are valuable features for both test methods. Hardness and strain rate sensitivity values measured on fused silica, single-crystalline and ultrafine-grained aluminum are seen to be in good agreement with literature values. This illustrates how strain rate control can be used to achieve both more consistent measurements and provide insight into the operative deformation mechanisms during indentation.
Introduction
Time is a parameter that is often desirable to optimize for mechanical testing. Often, the faster a measurement can be accurately performed, the better. This enables higher throughput testing of large test matrices or simply costs less time for a single quick measurement. However, the behavior of many materials is also time dependent, so a fast, accurate measurement will deliver a different value than a slower, but similarly accurate, measurement. This makes rate effects important to understand and control for when making measurements.
It is well known in uniaxial testing that strain rate applied during testing influences the measured stress level. The plastic stress-strain response of metals can be described using a simple power law relationship:
 where σ is the uniaxial stress, K is a materials property related constant, ϵ is the strain, n is the strain hardening exponent, ϵ̇ is the strain rate, and m describes the strain rate sensitivity or SRS. Depending on the magnitude of m, results performed at different rates may vary slightly or very significantly.
During indentation with self-similar indenters, such as pyramids or cones, the representative strain of the indentation is fixed as a function of the equivalent cone angle of the indenter tip. This means that the average, representative strain experienced by the material underneath the indentation is constant as a function of penetration depth: shallow indentations have the same strain as deep indentations. This is because they are geometrically the same. This means that the strain hardening exponent, n, is usually not considered in self-similar indentation testing. However, the strain field underneath such an indentation is generally understood as a complex expanding 3D plastic zone with local gradients in stress and strain. But, since the average strain and shape of this complex strain field is considered to be constant, the strain rate can be described as the rate of change in depth vs the achieved depth, i.e., how fast the deformation was made. In displacement control, this is a simple relationship of the displacement rate, ḣ , divided by the current displacement, h . However, for materials with power-law behavior, the relationship with strain rate is more complex. In general, it is assumed to be proportional to half the loading rate, Ṗ , divided by the current load, P. Using dimensional analysis, Cheng and Cheng [1] determined the relationship to be
This means that either the displacement or loading rate needs to be maintained at a fixed ratio during testing in order to perform a test at a constant strain rate. Otherwise, the measured hardness of the material would change with the applied strain rate during test, rather than maintain a constant value. This can be observed as a function of depth within a single indentation if continuous stiffness measurement (CSM) is employed, or the hardness would be seen to vary with depth if multiple monotonic Oliver and Pharr (O&P) [2] indentations are performed.
Elastic modulus is largely independent of rate effects unless the measurement speed approaches the speed of sound (elastic wave propagation speed) in that material, so elastic modulus measurements are generally considered to be independent of rate effects.
Thus, there are three test profiles that can be employed during nanoindentation, constant displacement rate (CDR), constant loading rate (CLR), and constant strain rate (CSR). Additionally, the strain rate can be dynamically changed during indentation to perform strain rate jump (SRJ) testing. Strain rate jump tests typically provide a reliable and repeatable indication of strain rate sensitivity due to the intrinsic consistency in microstructure and dislocations being tested. Since the same volume with nearly identical microstructure and dislocation structure is being tested, the only variable within the test is the strain rate. This has been found to be especially true for indentation testing, where constant strain rate testing is sensitive to local microstructure and dislocation nucleation [3, 4]. Moreover, a reduction of indentation time, especially for low strain rates, directly leads to a reduction of creep and thermal drift influences.
In this application note, we describe the relationship between strain rate and the measured hardness in different control modes. This is best performed using displacement control, as it has the most direct relationship to strain rate control, and using continuous stiffness measurement to provide hardness measurements as a function of depth. This allows strain rate jumps to be performed with the hardness continuously evaluated during the jumps. Both CSR and SRJ tests are performed on fused silica, single crystalline and ultrafine-grained aluminum to illustrate the influence of strain rate on measured hardness values, and the resulting strain rate sensitivity values for these materials are analyzed and discussed.
Experimental Considerations
To examine the relationship between indentation behavior and the applied strain rate, we first look at the system features desirable for these tests: displacement control and continuous stiffness measurement. Then we discuss the sample preparation and nanoindentation test methods applied here.
Displacement Control
As discussed in the introduction section, the indentation strain rate is a direct function of the displacement rate divided by the current displacement. This means that displacement control is the ideal control mode for testing with controlled strain rates. In load control, a similar proportionality is observed, but this is not a direct relationship. This means that deformation mechanisms other than power-law plastic flow may cause deviations from the desired strain rate.
During intermittent flow under load-controlled testing, pop-ins or rapid displacement bursts are observed. During a pop-in, the indentation strain rate spikes, which often results in the control feedback loop performing a proportionally strong unloading segment to return the applied strain rate back to its setpoint.
In displacement control, the strain rate remains nearly constant during intermittent flow, as the load drops produced by the same dislocation activity only produce small decreases due to elastic unloading. This makes it important to optimize the frame stiffness of displacement-controlled systems to minimize the influence of this. However, only transient decreases in strain rate are experienced due to this, not overshoots, unlike displacement control.
Continuous Stiffness Measurement
Continuous stiffness measurements (CSM) allow the acquisition of many stiffness measurements to be acquired as a function of penetration depth during a single indentation. This allows hardness and reduced modulus to be measured as a function of depth during indentation. In the absence of CSM, the actual hardness cannot be determined as a function of depth without performing numerous unloading cycles to measure the stiffness by the Oliver & Pharr method [2]. Otherwise, the instantaneous hardness can be inferred using the load over the current depth [5], but this neglects elastic unloading and does not constitute a true hardness measurement.
To prevent fatigue of the near surface [6] and accurately capture the indentation size effects, as seen in Figure 3, these oscillations should ideally be small relative to the indentation force and depth during the oscillation. This is why it is important that the initial oscillation amplitude is kept sub-nanometer, so that the force amplitude of the oscillation is also kept to a small fraction (in this case 10%) of the total load.
Sample Preparation
Fused silica (FS) samples were acquired (Thor Labs GmbH, Lubeck, Germany) for use as a calibration reference. Reference elastic modulus, E, and Poisson’s ratio, ν, values were measured (National Physical Laboratory, Teddington, UK) according to BS EN 1389:2003 and BS EN 843-2:2006 using pulse-echo ultrasonics. Among 10 samples, values were determined to be E = 72.86 ± 0.07 GPa and ν = 0.162 ± 0.001, which according to
 and using values for a diamond indenter (E = 1120 GPa and ν = 0.07) produces a reduced modulus value of Er = 70.24 GPa for the fused silica. These samples are used as standard references for indenter area function calibrations and as a test sample for this application note.
A -oriented single crystalline (SX) aluminum sample (purity: >99.99%) was acquired (MTI Corporation, Richmond, CA, USA). Ultrafine-grained (UFG) aluminum samples were produced by high pressure torsion (HPT) at Montanuniversität Leoben using a similar technique to [7]. All the sample surfaces were conventionally prepared using standard metallographic techniques followed by broad argon ion beam milling using a Hitachi IM4000 system to remove surface deformation layers. This facilitated electron backscatter diffraction (EBSD) of the UFG aluminum samples using a FEI Quanta 200 FEG SEM, which was determined [8] to have an average grain size of ~0.7 µm.
Indentation Procedures
Nanoindentation testing was performed on each sample using an NMT04 with a diamond Berkovich indenter on a FT-S200,000 sensor. Testing was performed in situ in a Zeiss EVO 25 scanning electron microscope (SEM) operating at an acceleration voltage of 10 kV. Each indentation was performed using a continuous stiffness measurement (CSM) method [2] in displacement control. The indentations were performed with an oscillation frequency of 200 Hz and an amplitude that linearly increased from 0.5 to 3 nm with increasing depth.
Indentations were performed on the UFG Al sample using CDR, CLR, and CSR test profiles to compare the differences in strain rates and hardness values between the difference methods. Profiles were designed to keep the tests as similar as possible.
Constant strain rate indentations were performed on SX Al, and UFG Al at strain rates of 0.1, 0.01, and 0.001 s-1. Fused silica indentations were made to a maximum depth of 1000 nm and using an order of magnitude faster strain rates. Indentations in Aluminum samples were made to target depths of 3000 nm to avoid influence of ion milling roughness and intermittent flow regimes.
Indentation strain rate jump tests were performed using a method similar to that of Maier et al. [4], where the strain rate is abruptly varied during indentation to several different levels. A minimum of 4 indentation strain rate jump tests were performed at strain rates of 0.1, 0.01, and 0.001 s-1. The indentation strain rate was initially held constant at 0.001 s-1 until a depth of 1000 nm was reached, ensuring that a constant microstructure was present underneath the cube corner tip. Afterwards, the applied strain rate was jumped up to 0.1 s-1, then back to 0.01 s-1, down to 0.001 s-1, and finally to 0.01 s-1 with each segment maintained for 500 nm of displacement resulting in a maximum indentation depth of 3000 nm. By repeating the same strain-rate during multiple segments at different indentation depths, the reversibility of the jumps can be illustrated [4]. This demonstrates that the hardness is constant for a fixed indentation strain rate.
Results
Influence of Test Profile
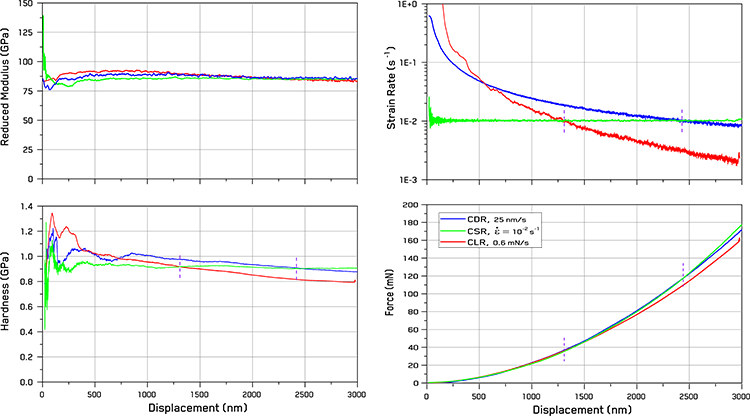
Figure 1. Comparison of indentation behavior as a function of control mode (CDR – Constant Displacement Rate, CSR – Constant Strain Rate, and CLR – Constant Loading Rate) on the UFG Aluminum sample with cross-over points marked where the different loads, strain rates, and resulting hardness values intersect between modes..
The test profile applied during testing can be seen to have a large effect on the displacement-force relationships, strain rates, and resulting hardness trends - Figure 1. As stated before, reduced modulus measurements are largely independent of the test profile. However, both the measured force and hardness as a function of displacement can be seen to scale positively with the strain rate: higher strain rates yield higher forces and hardness values.
During testing at constant strain rates, both the hardness and strain rate are constant with displacement throughout the indentation. Some small variations are seen at low depth due to surface roughness (Figure 4) and intermittent plasticity, but the remainder of the test is constant.
Tests using constant displacement rates (CDR) or constant loading rates (CLR) both produce a gradient in strain rate as a function of depth - Figure 1. For CDR testing, this follows a simple inverse relationship due to the equation above, whereas for CLR testing the trend is an inverse square due to the typical relationship of load and displacement from Kick’s law behavior. This means that CLR testing produces much larger variations than CDR testing, which is what is observed.
To achieve consistent hardness values with depth, CSR testing should be performed. Figure 1 shows that near constant values of hardness (H ≈ 0.9 GPa) are obtained from the UFG Al sample vs displacement. Since UFG Al is relatively strain rate sensitive, the hardness of the material scales significantly with strain rate. CDR tests produce a modest gradient in strain rate with displacement, which is seen in its gradual decrease in hardness vs displacement. As the strain rate decreases below the CSR value of 0.01/s at ~2450 nm, the measured hardness value from CDR testing also intersects the measured hardness from CSR. A similar intersection is observable between the CLR and CSR tests at a displacement of ~1300 nm.
The relative scaling of the hardness values between the different test control modes or test profiles is thus shown to be a direct function of the applied indentation strain rate during testing. For CSR and CDR testing, the strain rate will follow an established function vs displacement for any material. However, for CLR testing, the magnitude of the strain rate gradient will also depend on the hardness of the material as well as the loading rate; harder materials will have lower strain rates for a given loading rate than soft materials.
This is an important consideration for indentation mapping, since this means that either CSR or CDR testing should be used to ensure all phases are indented using the same strain rates. Otherwise, the strain rate variation will obscure the true hardness variation between the phases.
Fused Silica
As the standard reference material for nanoindentation testing, fused silica is an important material to examine. Figure 2 shows the force, hardness, and modulus as a function of the displacement or contact depth at several different constant strain rates and from a strain rate jump indentation.
Reduced modulus is seen to be constant among all tests, despite the strain rate variations. This is why the elastic modulus is preferred for area function calibrations, rather than hardness. As hardness will only be constant with depth using CSR testing, as seen in Figure 1.
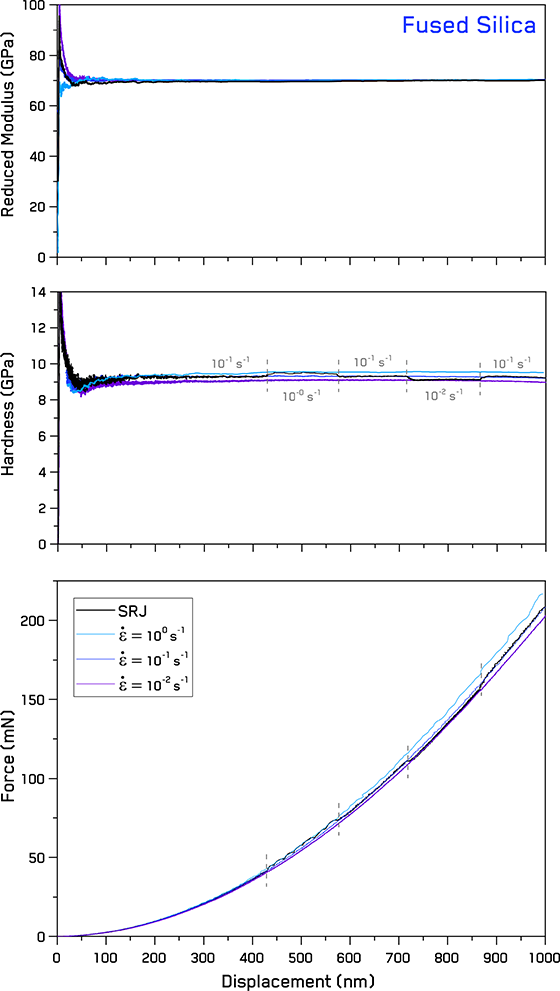
Figure 2. Force, hardness, and reduced modulus vs displacement for fused silica at different constant strain rates and strain rate jumps.
The hardness values for each constant strain rate are a flat plateau without any size effects. A small positive strain rate sensitivity is observed with hardness between the different CSR tests, and hardness values are seen to be reversible during strain rate jump tests. After each jump, the hardness quickly reaches a plateau whose value closely corresponds to the hardness value seen at the same strain rate during CSR testing.
Single Crystal Aluminum
Results from testing on the single-crystalline aluminum (Figure 3) show two different characteristics from that seen in the previous section on fused silica: intermittent plasticity and indentation size effects (ISE). Hardness values at low depths fluctuate due to numerous stress drops corresponding to dislocation nucleation events in the pristine, ion-polished surface of the aluminum single crystal. As aluminum does possess a native surface oxide, we cannot exclude that these drops may also be related to surface cracks, but this seems less likely than dislocation nucleation to have such a persistent influence to depths of ~500 nm.
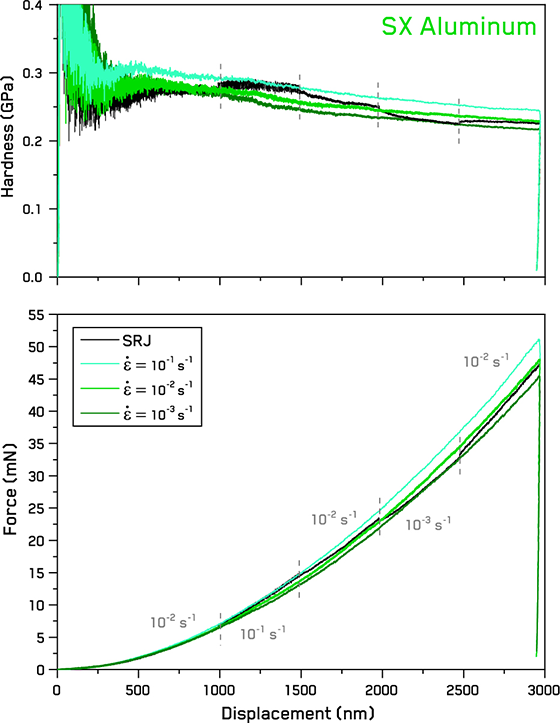
Figure 3. Force and hardness vs displacement curves for SX Aluminum at different constant strain rates and strain rate jumps.
A significant indentation size effect is also noticeable in the hardness curves, as expected for a well-annealed single-crystalline metal. On comparing the hardness values between the different CSR tests, we see that the ISE appears to be consistent, independent of the applied strain rate. This is in good agreement with previous observations on single crystalline tungsten [9].
Strain rate jumps during indentation are observed to have a noticeable effect on the force-displacement response in Figure 3. The measured forces gradually shift towards the values of the corresponding CSR test during each jump. The hardness values during the SRJ testing shows similar behavior. If the ISE influence is subtracted, the hardness values at each jump reversibly return to approximately the same value when the strain rate returned to that rate, as seen before [4].
As indentation testing was performed in situ in a scanning electron microscope. The indentation testing of the aluminum samples was recorded on video at an observation angle of 10° from the sample plane. Still micrographs from different stages of the indentation process are shown in Figure 4.
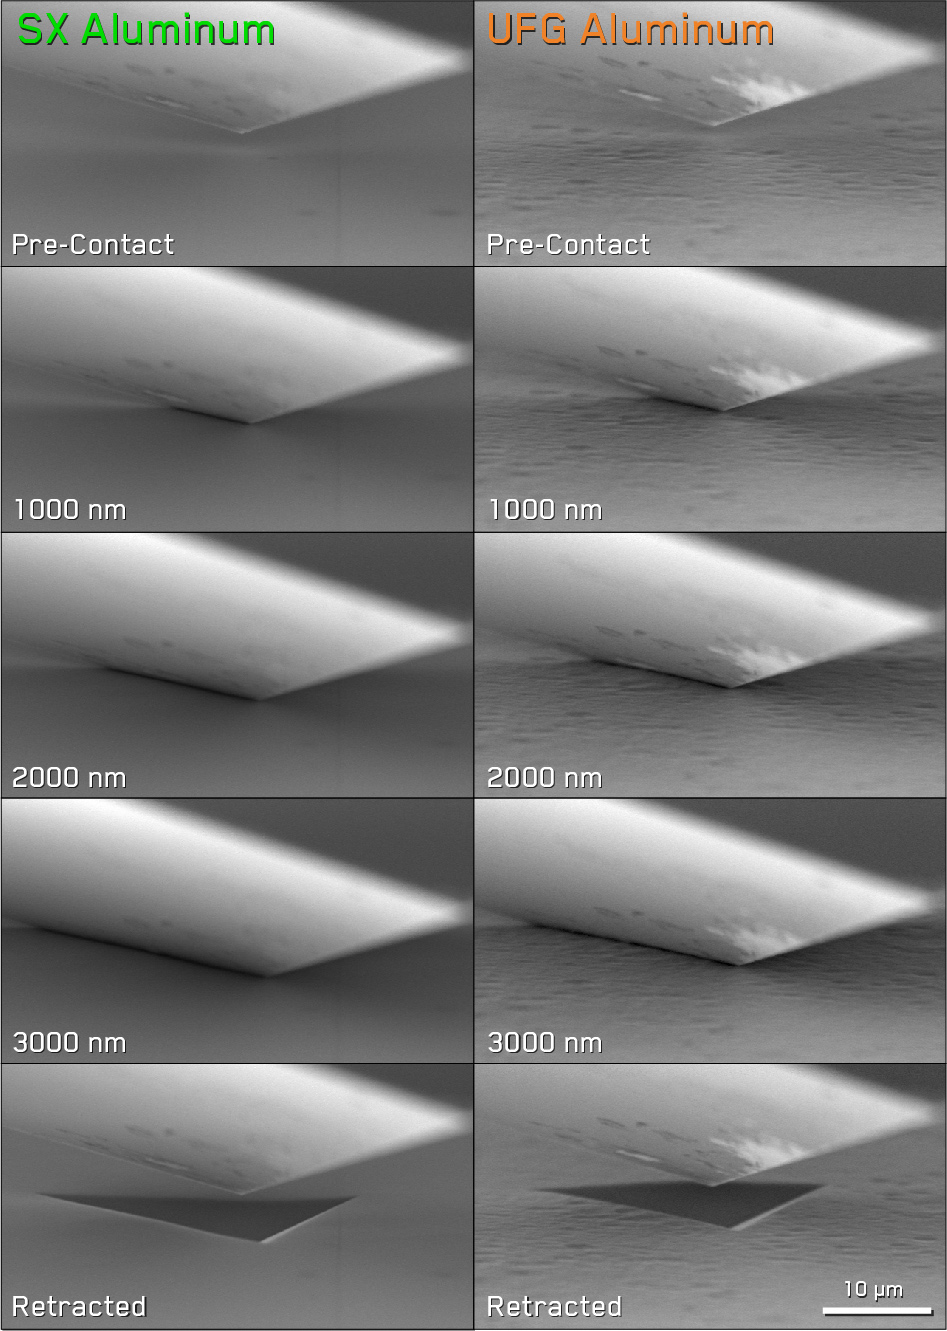 Figure 4. Secondary electron micrographs captured in-situ during indentation showing the progression of the deformation at different displacements.
These capture not only the differences in surface deformation due to pile-up between these two samples but also provide an indication of the variation in surface quality. As the SX Al sample is a uniform single crystal with a [100] orientation, ion polishing did not induce significant surface roughening of the sample. However, the UFG Al sample features numerous different crystal orientations, which each possess a slightly different ion polishing rate. This causes some surface relief to form between the different grains and roughens the sample surface slightly, as observable in Figure 4.
Concerning pile-up, the SX Al sample appears to behave nearly perfectly plastically, with only a very slight amount of pile-up observable in the middle of the left-front facet after the indenter was retracted. The UFG Al sample shows more significant pile-up in the form of visible curvature to the edges of the indentation, especially at the rear facet. This is consistent with previous observations using a Cube Corner indenter geometry [5]. As expected due to the smaller degree of shear deformation during Berkovich indentation, the degree of pile-up observed here is much less than previously observed.
Ultrafine-grained Aluminum
Results from the UFG Al sample are shown for the different constant strain rates and strain rate jump indentations in Figure 5. As seen in Figure 1, UFG Al has much more significant strain rate sensitivity than either fused silica or SX Al. This is immediately apparent in both the hardness- and force-displacement relationships in Figure 5.
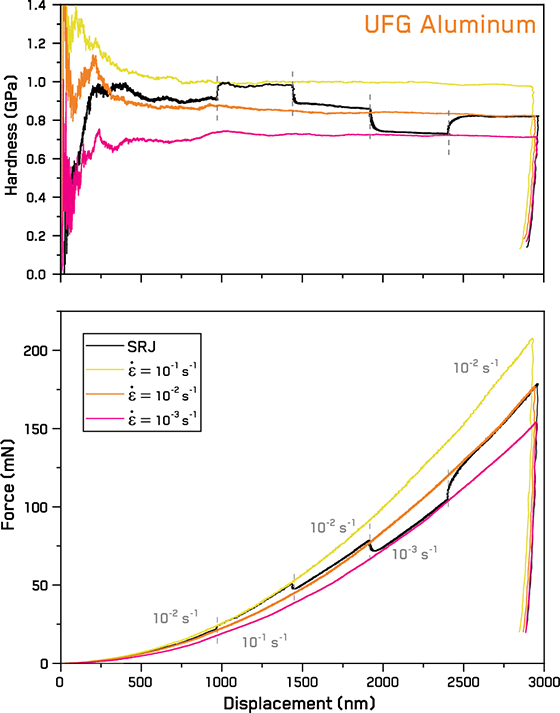
Figure 5. Force and hardness vs displacement curves for UFG Aluminum at different constant strain rates and strain rate jumps.
As noted in SX Aluminum, there is some intermittency at shallow depths in the UFG Al. This is also attributed to dislocation motion. However, given the ~0.7 µm grain size of this material, the magnitude of the intermittency is reduced. Some scatter is also observed in the hardness values at shallow depths due to the surface roughness caused by the ion polishing (Figure 4).
Hardness exhibits mostly stable plateaus at each strain rate in both CSR and SRJ indentations with little evidence of an indentation size effect. This is consistent with previous observations for ultrafine-grained and nanocrystalline metals [9].
Discussion
From these tests at various strain rates, the strain rate sensitivity, m, can be determined using the following relationship [4, 10]:
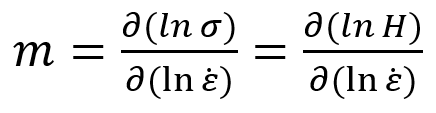 which results from the first equation. Using the Tabor confinement parameter, the Berkovich hardness value is related to the equivalent flow stress, σf, at 7% representative strain (eBerkovich = 7%) by the relationship, σf = H/2.8 [4]. This makes the strain rate sensitivity exponent, m, the slope of the trend on a log-log plot of stress and strain rate - Figure 6. The values shown in Figure 6 are taken from the final 10-20% of the hardness curves of the CSR indentations, and the hardness values from the SRJ tests were taken after subtracting the influence of the ISE. Values for fused silica are not plotted, but the measured strain rate sensitivity (m = 0.011) is consistent with previous measurements [9].
The strain rate sensitivity for UFG Aluminum in Figure 6 is found to be significantly higher than that observed for SX aluminum in both CSR and SRJ test profiles, as seen before [11]. Values from both CSR and SRJ methods are in good agreement for each material. However, the m value from CSR testing is noticeably larger than the SRJ value for UFG Al. This is attributed to the increased influence of stress-assisted creep deformation in the longer duration CSR tests (~2 hrs for 0.001 s-1) compared to the more rapid SRJ tests (~15 min per test including all rates). Good agreement between the two is seen at the highest strain rate. In the SX Al, the variation seen between the CSR and SRJ is due to the indentation size effect, as the SRJ values are effectively taken from the middle of the curves, while the CSR values are measured from the ends.
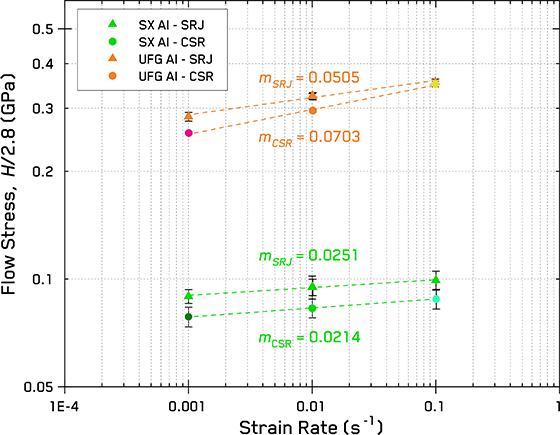
Figure 6. Flow stress (H/2.8) as a function of the applied indentation strain rate with the measured strain rate sensitivity, m, labelled as the slope.
A few observations can be made from these data. All of the materials tested here show positive strain rate sensitivity: higher speed → higher stress. This is the most common case, even if the trend is sometimes very small. Some cases of negative strain rate sensitivity do exist, e.g. materials which dynamic strain aging or the Portevin–Le Chatelier (PLC) effect, but this is less common. Extreme cases of strain rate sensitivity (m > 0.3) also exist in superplastic materials, which can undergo plastic deformation without fracture of >600%. The three materials investigated each showed different transient behavior during the rate jumps. Transients in the UFG Al are much smaller than those observed in the SX Al sample, particularly at lower penetration depths. This would be consistent with the transient size being proportional to the dislocation density necessary to accommodate the deformation. The SX Al sample has a low initial dislocation density compared to the UFG Al, and the required dislocation density to accommodate the deformation increases with depth. The amorphous fused silica sample, which deforms by densification rather than dislocation motion, also displayed short transients.
These observations point to the fact that the time dependence or SRS of deformation can act as an indicator of the operative plastic deformation mechanism. The time-dependence provides a “fingerprint” for the deformation mechanism, which is called the activation volume, V. The strain rate sensitivity exponent, m, can also be written as: 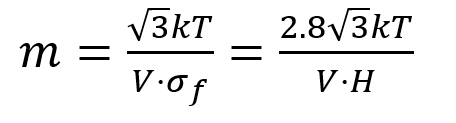
where k is the Boltzmann constant, T is the absolute temperature, σf is the equivalent flow stress, H is the hardness, and V is the apparent activation volume for the plastic deformation. Using this relation, the activation volume for deformation can be determined from the SRS, as shown in Figure 7. The activation volume is often discussed in terms of the thermally-activated motion of dislocations with different dislocation mechanisms being associated with different ranges of values over several orders of magnitude of volume [12], which is scaled in terms of cubic Burger’s vectors, b3.
![Activation volume values from literature [8] compared with current values.](https://www.oxinst.com/learning/uploads/inline-images/ni-an6-fig7-560-20250526092136.png)
Figure 7. Activation volume values from literature [8] compared with current values.
The literature data for the SX aluminum show the typical values (100-1000 b3) for dislocation intersections cutting through forest dislocations in compression [12], while the UFG aluminum shows values (10-20 b3) associated with thermally-activated deformation processes at the grain boundaries. This is in good agreement with macroscopic investigations [11] and demonstrates the utility of nanoindentation to measure the strain rate dependence of materials.
Conclusions
In this application note, the relationships between the applied strain rates during indentation with different test profiles and the resulting measured hardness were explored. Constant displacement and constant loading rate profiles both produce a progressively decreasing strain rate profile with increasing penetration depth which can cause a decreasing hardness trend, similar to the indentation size effect. The magnitude of the displacement or loading rates act to scale this trend, causing inconsistencies in hardness measurements. More consistent hardness measurements are achieved using a test profile that produces a constant strain rate during indentation. This is best achieved using a displacement-controlled indenter, since this has the most direct relationship with indentation strain rate. With continuous stiffness measurement, the hardness and elastic modulus can be measured as a function of depth, which allows visualization of hardness trends with strain rate.
This facilitates strain rate jump testing, which allows strain rate sensitivity to be investigated on local microstructural features more rapidly than possible by multiple constant strain rate tests. As the jumps in strain rate are performed during one indentation, the measured strain rate sensitivity is more consistent and representative of that microstructure. Whereas constant strain rate tests may have variation in local microstructure from indentation to indentation.
Both constant strain rate and strain rate jump testing with varying levels of strain rate were performed a variety of materials: fused silica, single crystal and ultrafine-grained aluminum. Measured values for strain rate sensitivity and activation volume were found to be consistent with literature values for these materials. This illustrates how strain rate control can be used to achieve both more consistent measurements and provide insight into the operative deformation mechanisms during indentation.
References
- Y.T. Cheng, C.M. Cheng, Materials Science and Engineering: R: Reports: A Review Journal, 44 (2004) 91-149.
- W.C. Oliver, G.M. Pharr, Journal of Materials Research, 7 (1992) 1564-1583.
- J. Alkorta, J.M. Martínez-Esnaola, J. Gil Sevillano, Acta Materialia, 56 (2008) 884-893.759.
- V. Maier, K. Durst, J. Mueller, B. Backes, H.W. Höppel, M. Göken, Journal of Materials Research, 26 (2011) 1421-1430.
- J.M. Wheeler, V. Maier, K. Durst, M. Göken, J. Michler, Materials Science and Engineering: A, 585 (2013) 108-113.
- M.J. Cordill, M.S. Lund, J. Parker, C. Leighton, A.K. Nair, D. Farkas, N.R. Moody, W.W. Gerberich, International Journal of Plasticity, 25 (2009) 2045-2058.
- R. Pippan, S. Scheriau, A. Taylor, M. Hafok, A. Hohenwarter, A. Bachmaier, Annual Review of Materials Research, 40 (2010) 319-343.
- Y. Xiao, V. Maier-Kiener, J. Michler, R. Spolenak, J.M. Wheeler, Materials & Design, 181 (2019) 107914.
- K. Durst, V. Maier, Current Opinion in Solid State and Materials Science, 19 (2015) 340-353.
- E. Hart, Acta Metallurgica, 15 (1967) 351-355.
- J. May, H.W. Höppel, M. Göken, Scripta Materialia, 53 (2005) 189-194.
- A. Evans, R. Rawlings, physica status solidi (b), 34 (1969) 9-31.

