i04
View Product
 Part of the Oxford Instruments Group
Mechanical microscopy allows the imaging of mechanical property variations at multiple length scales. Nanoindentation mapping is usually performed at the microstructural length scale, but many manufacturing processes create property variations on larger scales, e.g. case hardening, nitriding, or designed variations through additive manufacturing. In this series of application notes, we demonstrate how mechanical microscopy can be performed at multiple length scales to connect large-scale variations in mechanical properties to their mechanical properties on a microstructural length scale. This demonstrates the wide range of measurements possible with FemtoTools systems. In this first note, we investigate the correspondence between conventional Vickers hardness measurements and high load nanoindentation and mapping on a case-hardened medium carbon steel. This application of mechanical microscopy to measure meso-scale property variations demonstrates the multi-scale property characterization capability of the technique.
Mechanical microscopy allows the imaging of mechanical property variations, such as hardness and reduced elastic modulus, over a sample’s surface. This is typically performed at the microstructural length scale using nanoindentations with depths on the order of 20-200 nm. However, mechanical microscopy is truly a multi-scale technique, which allows spatial resolution from the sub-micron scale up to the millimeter or centimeter scale. This is simply accomplished by simply performing either a numerically large map of fine-scale indentations over a large area or by using larger indentations at proportionally greater spacings. By performing mechanical microscopy at the meso-scale, larger scale property variations resulting from manufacturing processes such as case hardening, nitriding, or designed variations through additive manufacturing can be measured.
Case hardening is a well-known surface treatment for steels that hardens the surfaces of parts through heat treatments to induce phase transformations from soft, ductile Ferrite to hard, brittle Martensite. This greatly improves the wear behavior of the surfaces of parts such as gears and camshafts due to the increased hardness, and the surface hardening also increases the fatigue performance of the parts. This produces a large gradient in mechanical properties and microstructure over a sample. Traditionally, this would be investigated using Vickers hardness measurements, as the hardened area can vary over several millimeters.
In this application note, we demonstrate the correspondence between Mechanical Microscopy using high speed nanoindentation mapping and traditional Vickers hardness measurements on a case-hardened, medium-carbon steel sample. This showcases the ability of Mechanical microscopy to characterize meso-scale properties of materials, which requires a combination of high frame stiffness and high load capabilities. In subsequent notes, we will connect these high load properties to those at the microstructural length-scale.
A sample of medium carbon C45 steel (1.0503) was induction hardened at 850 °C and tempered at 210 °C to generate a case-hardened layer. The sample was metallographically investigated by sectioning, polishing, and etching with alcoholic nitric acid ~ 3% (Nital) to reveal the underlying microstructure. The sample was then repolished for indentation by using successively finer media to a final polish with a 50 nm alumina suspension.
Traditional hardness measurements were carried out using an MXT-α Microhardness tester (Wolpert AG, now owned by Buehler Ltd.) according to ISO 6507-1 [1]. This defines that the loading time (time between first contact and full load application) should be between 2-8 seconds and that the velocity during indentation should be below 70 µm/s. Dwell time at maximum load is required to be between 10-15 seconds. Lines of indentations were performed to measure Vickers hardness at two different loads: HV0.1 at 0.9807 N (0.1 kgf) and HV0.5 at 4.903 N (0.5 kgf). These were manually spaced at ~250 µm using a micrometer-stage. Indentations were performed with a 2 s loading cycling and a 10 s dwell time.
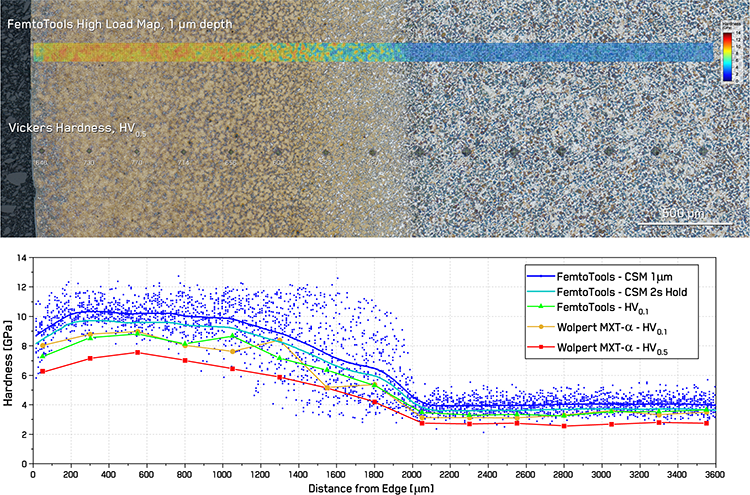 Figure 1. Hardness variation over case-hardened C45 steel in cross-section – Optical micrograph showing the etched microstructure with a high load indentation map and Vickers hardness tests and the corresponding hardness as a function of distance. Values for Vickers and simple indentation converge when testing parameters match.
To illustrate the correspondence between new high-speed indentation mapping in displacement control and traditional Vickers measurements in load control, a range of tests were performed with the i04 Femto-Indenter with a diamond Berkovich indenter on a FT-S2,000,000 sensor using different control parameters. Load-controlled simple indentations were performed in a line matching the distances of the Vickers indentations at forces of 0.9807 N with a 2 s loading cycling and a 10 s dwell time. This provides a close match to the Vickers testing parameters, with the exception of the Berkovich indenter geometry and the measurement principle.
Nanoindentations using the simple indentation mode use the Oliver-Pharr analysis [2] to determine the contact area from the unloading stiffness. This is an automated procedure, relatively free of user input or error. Vickers hardness measurements determine the contact area of the indentation from the length of the two diagonals of the Vickers indentation, which is usually measured by a user and subject to their consistency and the precision of the microscope used to image the residual indent.
A nanoindentation map of 360×10 indents (Figure 1) was also performed using the continuous stiffness measurement (CSM) method [2] in displacement control. Each indentation was performed to a specified depth of 1 µm with a dwell period of 2 s at the target depth. A spacing of 10 µm between indentations was used to ensure an indentation depth/spacing ratio of 10 was maintained [3]. This avoids any significant interaction between neighboring indents.
A summary of the results acquired on this case-hardened C45 steel sample is shown in Figure 1. The resulting values from the variety of hardness tests performed across this microstructure are shown in the lower portion of Figure 1. This is scaled to match the optical micrograph, so that the trends visually coincide. The optical micrograph of the etched cross-section reveals the microstructural transitions undergone by the C45 steel during case hardening. The outer portion of the steel on the left has been transformed into Martensite, resulting in significant hardening. The outermost region of the, near the dark bakelite, shows a bit of a depletion in Martensite volume fraction and hardness likely indicating some decarburization. With increasing distance from the surface, a plateau in hardness is observed, corresponding to a high percentage of Martensite. This is followed by a transition region where a mixture of Martensite and Ferrite is observed with intermediate hardness. Finally, a lower plateau in hardness is observed corresponding to the substrate, medium-carbon steel consisting of Pearlite and Ferrite. Pearlite observed in the etched microstructure in its namesake rainbow colors interspersed with white Ferrite.
Two types of hardness test are illustrated on the optical micrograph: displacement-controlled hardness mapping and load-controlled Vickers hardness. The hardness map reveals local fluctuations in mechanical properties, corresponding to the underlying microstructure, while the Vickers hardness indentations visually indicate the variation in hardness via the increase in indentation size in softer regions. This variation in indentation size with constant load precludes load-controlled indentation grids from performing a regular indentation map, where consistent indentation size is required to maintain a consistent indentation spacing.
Two trends in the data emerge on closer investigation: load- and time-dependence. In both the hardened and substrate portions of the steel, hardness is observed to increase with decreasing loads. This is clearly observed in the difference between the HV0.1 hardness values at 0.9807 N and the HV0.5 measurements at 4.903 N. This difference is of a similar magnitude between the HV0.1 values and the average values from the displacement-controlled, 1 µm spacing indentation map, where loads varied between ~0.1-0.2 N between the soft and hard regions. Average values for the displacement-controlled map are plotted as a dark blue line using a locally-weighted smoothing algorithm (Lowess).
This effect of load/size thus accounts for the majority of the variation between traditional Vickers and modern indentation mapping. Values obtained using the same loading parameters using Vickers or Simple Indentation according to ISO 6507 for HV0.1 show very consistent values with some variation due to local microstructure.
Some variation between Vickers and high-speed indentation mapping values is also expected to be due to time-dependence. This can occur due to indentation strain rates, as discussed in another Application Note, or due to creep/load relaxation. Creep deformation occurs when the indenter is held at maximum load for a fixed dwell period. ISO 6507-1 requires a dwell time at maximum load of 10-15 seconds [1], which is significantly longer than a typical high-speed indentation for mapping: ≤1 s. To illustrate this effect, we imposed a dwell period of 2 s at maximum depth after each mapping indentation and measured the decrease in hardness during the dwell. The Lowess average of this dwell hardness is shown in Figure 1 as a cyan line. Dwell hardness after 2 s is ~8% less than the hardness measured during loading using CSM. This is nearly half of the variation observed between fast mapping and Vickers hardness at ~5× higher loads, which have at least a 10 s dwell period. This highlights the importance of consistent testing parameters for measurement reproducibility.
In this application note, the capability of mechanical microscopy to image mechanical property variations at the meso-scale was successfully demonstrated using an FT-S2,000,000 sensor across a case-hardened C45 steel cross-section. Matching trends in hardness from all measurements were across the transition from the hardened Martensite region to the Pearlitic steel substrate. Simple indentation measurements made using ISO 6507-1 parameters were found to correspond well with Vickers hardness measurements made using the same parameters. Load or size dependence between fast mapping indentation and Vickers hardness was observed to be of a similar degree. This application of mechanical microscopy to measure meso-scale property variations demonstrates the correspondence of the technique with traditional Vickers Hardness techniques at higher loads, and demonstrates the importance of using identical test parameters to achieve consistent measurements.

© Oxford Instruments 2026