iX05
View Product
 Part of the Oxford Instruments Group
Correlated mechanical microscopy using nanoindentation and EBSD is a powerful technique for materials science investigations. This allows the extraction of orientation-property relationships, which are a fingerprint of the metal’s plastic and elastic anisotropy. Hexagonal-close-packed, HCP, metals are known for their anisotropic behavior. Titanium is an excellent example of this. In this application note, correlative mechanical microscopy with EBSD is used to determine the elastic and plastic anisotropy of commercial purity (grade 2) Titanium. Property distributions were observed to be a strong function of crystallographic declination angle with elastic behavior closely following theoretical predictions. Further, the property distributions show a non-Gaussian distribution related to the elastic and plastic anisotropy. This demonstrates the high sensitivity of displacement-controlled nanoindentation mapping, which provides property distributions that are a function of crystallographic orientation rather than statistical variation.
In this application note on Correlative Mechanical Microscopy, we extend the range of application from cubic metals to hexagonal metals. These often feature much greater degrees of anisotropic mechanical behavior, compared to cubic metals. Hexagonal close-packed (HCP) metals, e.g. titanium and magnesium alloys, are often employed in structures where a high strength to weight ratio of needed, which is crucial in many sustainability efforts through light-weighting. Titanium is a critical material for many aerospace applications.
To do understand the influence of crystal orientation on mechanical properties in these materials, correlative mechanical microscopy is performed by combining electron back-scattered diffraction (EBSD) and nanoindentation mapping on a polycrystalline microstructure of the metal. This provides a fingerprint of the metal’s deformation mechanisms and elastic behavior, providing that the region of the microstructure contains the full range of crystallographic orientations.
In this application note, nanoindentation and orientation mapping are used to perform correlative mechanical microscopy on commercial purity Titanium sample. An indentation technique employing continuous stiffness measurement (CSM) is used, providing sufficient precision to determine reduced modulus as a function of orientation. Details of the approach are described, particularly the system concerns, and the ability of the correlative approach to identify grains and trends in both elastic and plastic anisotropy is demonstrated and discussed. Mechanical property distributions are demonstrated to be a complex function of crystal orientation in HCP metals. These are often fit using statistics, clustering or machine learning algorithms to identify a single representative value within a phase’s distribution [1]. The indentation behavior of Titanium is analyzed as a function of its crystallographic declination and discussed in relation to literature values and predictions.
Displacement-controlled indentation mapping is highly preferable for correlative applications. In load control, the load must be carefully chosen to ensure that the spacing is proportional to the indentation produced in the softest phase or crystal orientation in the map. Otherwise, indentations in the soft region will overlap with its neighbors. This means for indentations maps performed in load control, a significant disparity in indentations depths and spacings can be expected for maps over dissimilar phases.
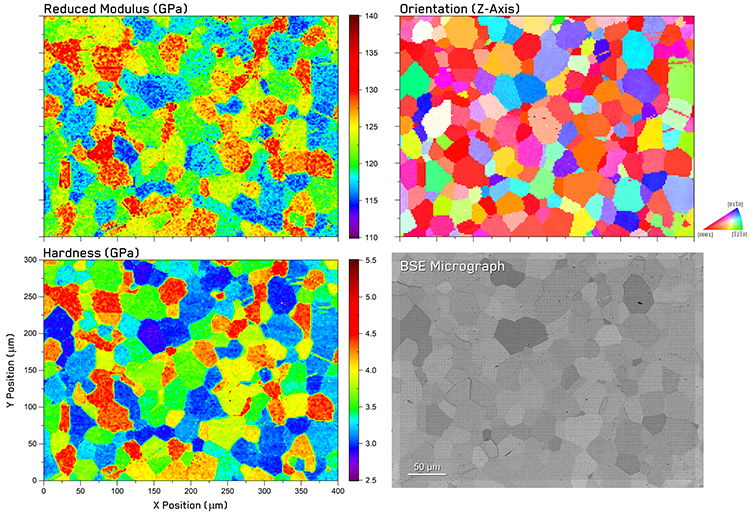 Figure 1. Mechanical microscopy results from commercial purity Titanium with correlated indentation property maps with EBSD orientation and backscattered electron micrographs of the same region.
In displacement control, indentations are all performed to the same maximum depth, ensuring similar indentation sizes and regular with minor variations from differences in elastic recovery. This is important for correlative measurements, so that every mechanical and analytical measurement is taken from the same volume of material.
A commercially pure sample of Titanium (Grade 2, material number 3.7035, Alfa Aesar GmbH & Co KG) was acquired and metallurgically mounted. The sample was metallographically prepared and polished using progressively finer abrasives until a final polish achieved using a 50 nm alumina suspension.
Nanoindentation mapping was performed using an i04 Femto-Indenter equipped with an FT-S20,000 sensor and a diamond Berkovich tip. Each indentation was performed using continuous stiffness measurement (CSM) method [2] in displacement control. An oscillation frequency of 150 Hz and a proportionally scaled amplitude that linearly increased from 0.5 to 2.5 nm with increasing depth was used. A map of 200×150 indentations was performed with a maximum depth of 190 nm and a 2 µm spacing. This ensured an indentation depth/spacing ratio of 10 was maintained [3]. Representative values for each indentation were determined from the mean of values measured at contact depths above 50% of the target depth for elastic modulus and 80% for hardness to minimize errors from indentation size effects.
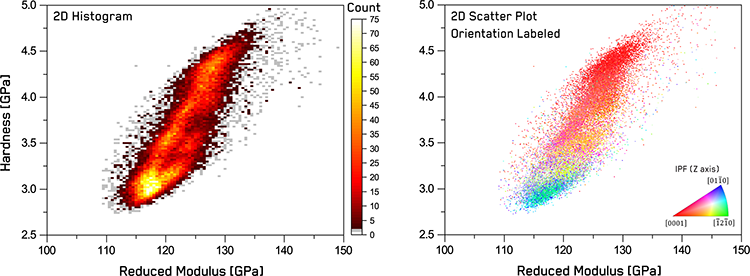 Figure 2. Statistics of correlated mechanical property distributions: 2D histogram of hardness vs reduced modulus and 2D scatter plot with datapoints color coded using correlated EBSD data.
Microstructural analyses were performed using analytical SEM, backscattered electron (BSE) imaging, and EBSD mapping Hitachi SU-5000 (Oxford Symmetry 2). EBSD measurements were performed at 20 kV with a step size of 1 μm and using a 4×4 binning and averaging of 2 frames. Noise reduction was performed using 5 nearest neighbors. Electron micrographs were taken of the test region with a Zeiss EVO 25 SEM at 10 kV using a HD Backscattered Electron Detector (BSE).
The results of correlative mechanical microscopy of grade 2 Titanium are shown in Figure 1. Excellent visual correlation is observed between mechanical property maps (Hardness and Reduced Modulus), the EBSD orientation map, and the BSE micrograph in both morphology and scale.
In general, the microstructure of the Titanium consists of equiaxed grains with a wide range of orientations with a few thin twins within some grains. EBSD maps reveal a basal texture, but grains with most orientations are also represented. Mechanical properties within grains appear uniform with no obvious irregularities near grain boundaries. A positive correlation is apparent between the hardness and reduced modulus maps with harder grains also showing higher reduced moduli, and vice versa. Grains near the basal orientation [ ], colored red on the orientation map, display the highest hardness and modulus. Grains oriented near the prismatic orientations of [ ] and [ ] (shown in blues and greens on the orientation map, respectively) display the lowest hardness and reduced modulus values.
As hardness and elastic modulus are interrelated properties, 2D histogram plots are often utilized to display the statistical distributions of the obtained H and E values over the entire mapped region simultaneously. This type of plot shows the number of indentations fitting within a fixed bin of H and E values, such that phases appear as clusters or peaks. In the 2D histogram in Figure 2, we see that the polycrystalline Titanium appears as a complex cluster elongated over a range of hardness and reduced modulus values in property space, rather than a single Gaussian peak. A ‘bright’ statistical peak appears at the lower range of mechanical properties, but the remainder of the values are uniformly distributed over the range.
This is an important feature to note, as many statistical deconvolution or machine learning clustering algorithms tend to try to segment individual phases by assuming their properties display a Gaussian distribution. Here, we can clearly observe this to be an oversimplification in the case of Titanium.
To understand this, we can use the correlated results from EBSD, to color-code the data as a function of the crystallographic orientation, as shown in the 2D scatter plot in Figure 2. This reveals the reason for the broad distribution to be the range in crystallographic orientations included in the mapped region. This plot of indentation properties and orientation represents a unique way of simultaneously showing both elastic and plastic anisotropy relationships with crystallographic orientation in a material or a fingerprint of its deformation behavior.
The shape of the distribution depends on the relationship between elastic and plastic anisotropy, while the coloring indicates the relationship of this anisotropy to crystallographic orientation. The distribution is mostly elongated along the hardness axis with a variation of ~75%, in contrast to the reduced modulus variation of ~15%. This differs strongly with previous observations in FCC materials [4], which often show larger modulus variation than hardness. In addition, the orientation dependence is also the opposite direction to FCC materials.
To discuss this orientation-dependence further, it is helpful to consider the results in terms of their declination angle, β (the second Euler angle, measured by EBSD), in Figure 3. In FCC metals, we observe a relatively weak linear increasing trend in hardness and reduced modulus as a function of declination angle, due to the large number of available slip systems reducing the effective anisotropy.
![Orientation dependence of hardness and reduced modulus of pure Titanium as a function of declination angle with datapoint color-coded using correlated EBSD data, along with hardness values and reduced modulus trends from the literature [10-12].](https://www.oxinst.com/learning/uploads/inline-images/ni-an26-fig3-750-20250602095031.png) Figure 3. Orientation dependence of hardness and reduced modulus of pure Titanium as a function of declination angle with datapoint color-coded using correlated EBSD data, along with hardness values and reduced modulus trends from the literature [10-12].
Figure 3. Orientation dependence of hardness and reduced modulus of pure Titanium as a function of declination angle with datapoint color-coded using correlated EBSD data, along with hardness values and reduced modulus trends from the literature [10-12].
In HCP metals, much more complicated slip behavior is expected, causing significantly more variation with orientation. This is consistent with the present observations for commercial purity Titanium: Figure 3. Instead of a simple linear increase in mechanical properties with declination, a decreasing sigmoidal trend in properties is observed with increasing declination angle. This trend appears as a string of tightly-clustered datapoints with consistent colors, corresponding to individual grains. Some datapoints appear to deviate from these clusters vertically along the mechanical property axes, which result from a small fraction of indentations falling on grain boundaries and being attributed to a neighboring grain’s orientation.
In terms of hardness values, several other efforts in the literature are available for comparison [5-8]. However, the experimental parameters (indenter geometry, indentation depth, indentation system, etc.) vary significantly between studies. This prevents easy comparison between hardness values. However, the values presented here are in close agreement with those of Texier et al. [9], but the large number of overlapping datapoints prevents a nice graphical presentation of this. However, one comparison was included with a study featuring an additively manufactured titanium alloy [10], including results from ~20 grain orientations. The current study features several hundred different grains – providing a near-continuous characterization of the orientation trends, which highlights the advantage of the high data numerosity of the correlative mechanical microscopy approach (30,000 correlated indentations). Hardness values for the pure Titanium are observed to be both lower in value and follow a different declination trend than the additively manufactured alloy.
The shape of the hardness trend is partly related to the change in reduced modulus. However, since the magnitude of the difference in hardness is so much larger than that of the reduced modulus, the orientation dependence of the hardness cannot be completely attributed to this. Instead, this is attributed to a change in dislocation glide behavior [6]. At high declinations, near prismatic orientations of [ ] and [ ], the hcp crystal is oriented to favor dislocations on the basal planes, which has the lowest critical resolved shear stress value in Titanium. At low declinations near [ ], these basal planes are oriented nearly perpendicular to the surface, making them difficult to activate. Therefore, it has been shown that dislocations on the pyramida
l planes are required to accommodate the indentation deformation [6]. These possess a critical resolved shear stress nearly 4× greater, which can account for the large increase in hardness at low declinations. These two mechanisms provide the minimum and maximum plateaus in hardness, while the intermediate declinations provide a gradient between them.
If we compare the measured trend (black line) in reduced modulus versus declination angle with the values determined using the Vlassak-Nix model (dashed line) from the literature elastic constants [9], we observe good agreement in both absolute values and vs. β slope. These values are in close agreement with those calculated using 3D FEM (dotted line) [11]. The precision of this correlated mechanical microscopy measurement is also sufficient that it could be used for an inverse determination of the elastic constants of the material [9], even as a function of oxygen content which strongly influences the modulus. Alloying also can significantly shift the modulus trends vs. declination [10, 11] to a degree much greater than the variation within our measurement.
Correlative mechanical microscopy with EBSD was applied to characterize the elastic and plastic anisotropy of polycrystalline, grade 2 Titanium. Direct correlations were observed between the mechanical properties and grain orientations. However, a contrasting trend is observed in HCP Titanium to previous FCC metals. The highest hardness and reduced modulus values are observed at low declination angle orientations near [ ], while grains oriented near the high declination angle orientations of [ ] and [ ] display the lowest values. The high precision of the measurements enabled by displacement-controlled, correlated mechanical microscopy revealed the statistical variation within indentation property space to be a complicated, non-Gaussian distribution resulting from the crystallographic orientation. Both hardness and reduced modulus were shown to follow a decreasing sigmoidal trend with declination, rather than the increasing linear trend observed in FCC metals. The variation in elastic anisotropy was found to closely follow theoretical predictions from elastic constants using the Vlassak-Nix model and FEM calculations. Large variations in hardness following a similar sigmoidal trend with declination were rationalized in terms of their dislocation mechanisms. The precision of these measurement was seen to be sufficient to differentiate between different titanium alloys. This application further validates the concept of correlative mechanical microscopy as a metal fingerprint of the material’s anisotropy.
The author gratefully acknowledges the contributions of the groups who assisted in these measurements. Dr. Indranil Basu of Prof. Loffler’s Laboratory of Metal Physics at ETH Zurich performed the EBSD characterization. EBSD and nanoindentation correlation was done by Sang-Hyeok Lee in the Department and Chair of Physical Metallurgy and Material Physics at RWTH in the group of Prof. Sandra Korte-Kerzel.

© Oxford Instruments 2026