Additive manufacturing of metal components is changing the way components are both designed and manufactured due to its capability to make complex geometries. However, additively-manufactured materials often feature novel microstructures and different mechanical properties than their conventional equivalent alloys. In this application note, 316L steel samples manufactured using four of the major additive manufacturing processes are investigated using mechanical microscopy. This is only possible using an indentation system with a combination of high sensitivity and the ability to tolerate surface features like porosity. The application of mechanical microscopy to additively-manufactured materials offers higher resolution characterization of both the microstructures and mechanical properties than previously possible.
Introduction
Additive Manufacturing (AM) is a transformative technology which enables rapid fabrication of complex geometries previously inaccessible by traditional methods. For AM of metallic parts, there are a wide variety of different methods being used and developed. The majority of AM processes can be divided into two sub-categories: melting processes and sintering processes. Melting processes typically start with either a powder bed or a wire feedstock, which is locally melted by various means to form individual voxels. Sintering processes consist of a method to combine metal powder with a binder medium into a desired shape, which is then sintered to form a solid metal part.
Each of these methods has its respective advantages and costs, as well as its resulting mechanical properties and microstructures. These vary both among the different techniques and within the techniques as a function of the processing parameters employed during deposition and by subsequent heat treatments.
In this application note, we investigate the capabilities of Mechanical Microscopy using high-speed nanoindentation mapping to assess the mechanical properties and microstructures of additively-manufactured 316L stainless steels. For this work, we have partnered with several research groups to obtain samples made with a variety of the main AM techniques: Laser powder bed fusion (LPBF), laser direct energy deposition (DED), fused filament fabrication of metal (FFFm), and binder jetting (BJ).
Experimental Considerations
To survey the capabilities of mechanical microscopy for additively-manufactured materials, in addition to the sample manufacture, there are several important factors about the nanoindentation system to consider: the indentation process, the system’s sensitivity, and if it can tolerate sample topology.
Sample Manufacture
Samples were provided by several research groups at ETH Zurich and a group at Cornell university. These represent two methods from melting processes (LPBF and DED) and two methods from sintering processes (FFFm and BJ).
Laser powder bed fusion samples were produced by the Bambach group in the Advanced Manufacturing Laboratory at ETH Zurich in cooperation with Aerosint SA. Samples were produced with target layer thickness of 40 µm with a laser power of 250 W at a scan speed of 0.9 m/s.
Laser directed energy deposition (LBAM) steel was deposited by the Hossani group at Cornell University with a laser power of 250 W at a scan speed of 800 mm/min. The powder feed rate was set to 0.5 rpm/min of the feeder. The LBAM sample consists of 30 layers with a target thickness of ~200 µm layers.
Fused filament fabrication of metal was performed by the Spolenak group in the Laboratory for Nanometallurgy at ETH Zurich using a novel method [1] for filament-based 3D printing of 316 L stainless steel. Sintering was performed in a hydrogen atmosphere at 1350 °C.
Binder jetting samples were made by an industrial partner with an initial layer thickness of 70 µm. Final sintering was performed in a hydrogen-filled batch oven at 1380 °C. Full details are available in reference [2].
All samples were then metallographically prepared and polished using progressively finer abrasives until a final polish achieved using a 50 nm alumina suspension.
CSM Indentation Procedures
Nanoindentation maps of 200×150 indents (Figure 1a) were performed on each sample using an i04 Femto-Indenter with a diamond Berkovich indenter on a FT-S20,000 sensor. Each indentation was performed using a continuous stiffness measurement (CSM) method [3] in displacement control. Typical results from one of these indentations is shown in Figure 1. The indentations were each performed in ~1 s with an oscillation frequency of 150 Hz and an amplitude that linearly increased from 0.5 to 2.5 nm with increasing depth, as shown in Figure 2. The total time for each indentation including repositioning was ~2.5 seconds.
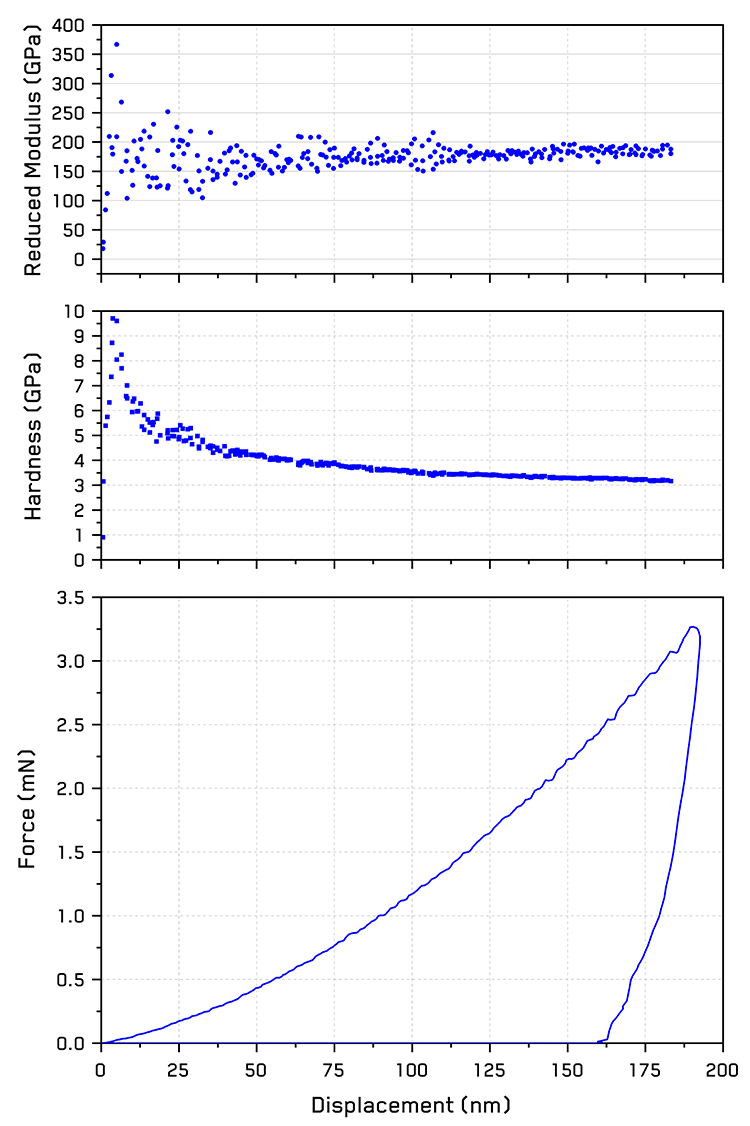
Figure 1. CSM indentation curves showing force, hardness, and reduced modulus as a function of displacement in 316L steel.
Each indentation was performed to a specified depth of 190 nm, so that a spacing of 2 µm between indentations could be used while still ensuring an indentation depth/spacing ratio of 10 was maintained [3]. This avoids any significant interaction between neighboring indents.
Hardness and reduced modulus were measured as a function of depth for each location, as shown in , and representative values for each were taken by averaging values from depths >150 nm to minimize the influence of indentation size effects for hardness values and >100 nm for modulus values.
Electron micrographs were taken of each test region with a Zeiss EVO 25 scanning electron microscope (SEM) at 10 kV using a HD Backscattered Electron Detector (BSE).
System Sensitivity
High speed, regular maps of indentations are not useful unless the measurement sensitivity is high enough to resolve the variations within the mapped region. The measurement sensitivity is a function of several parameters: force and displacement noise floors, system dynamics, repeatability.
The primary influence on system’s measurement sensitivity is its noise floor in both force and displacement. For performing nanoindentation maps, tolerances in measurement noise must be very tight, particularly for identifying the contact point and during CSM measurements. As shown in the inset in Figure 2, each µN of noise counts in order to accurately determine the initial contact point. For indentations with a total depth of < 200 nm, each nanometer of accuracy will have an effect.
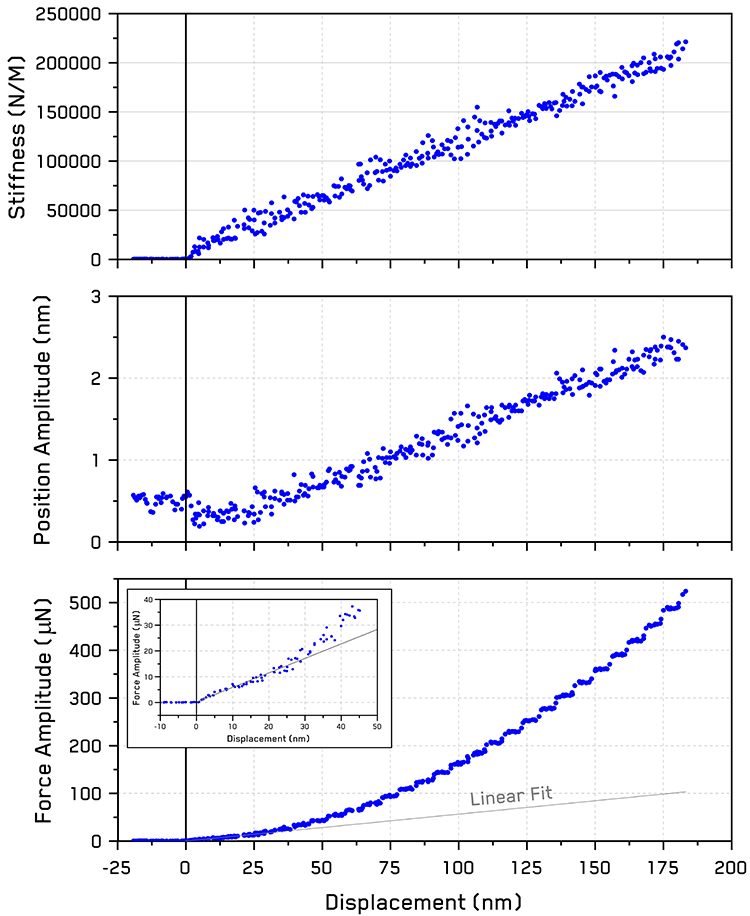
Figure 2. Dynamic measurements from CSM oscillations during indentation of 316L steel.
Continuous stiffness measurements (CSM) allow the acquisition of many stiffness measurements to be acquired as a function of penetration depth during a single indentation. This is how hardness and reduced modulus can be measured as a function of depth during indentation. To prevent fatigue of the near surface [4] and accurately capture the indentation size effects, as seen in Figure 1, these oscillations should ideally be small relative to the indentation force and depth during the oscillation. This is why it is important that the initial oscillation amplitude is kept sub-nanometer, so that the force amplitude of the oscillation is also kept to a small fraction (in this case ~15%) of the total load.
Surface Topology
Lastly, the positioning capabilities of the system should be able to map over large areas and tolerate imperfections in surface topology like roughness, tilted surfaces, cracks, and pores. Surface roughness simply requires a standard retraction distance, directly related to the height of the roughness, from the contact point after each indentation before lateral movement. Tilted surfaces are easily tolerated by using a meander path for mapping. This ensures the system never laterally moves farther than a single indentation spacing increment before finding the new contact point.
Local imperfections like cracks and pores require extra retraction distance to prevent the indenter from scratching the surface or laterally loading the indenter. As a first concern, the crack or pore cannot be larger than the indenter shaft, typically 200 µm wide, or the entire indenter shaft may become entrapped. If the indenter’s projected area is larger than the pore, the system will detect contact at a depth where the indenter’s facets or facet edges, not the apex, first encounter the pore’s edges. At first approximation, the difference between the contact depth and the apex depth would be the required retraction distance prior to lateral movement. Actually, the indenter does not have to be fully retracted, it only needs to move back far enough to allow it to laterally move the desired step size without hitting the sides of the pore/crack. This effectively allows the indenter to incrementally “climb” down into a pore and then “climb” back out step by step.
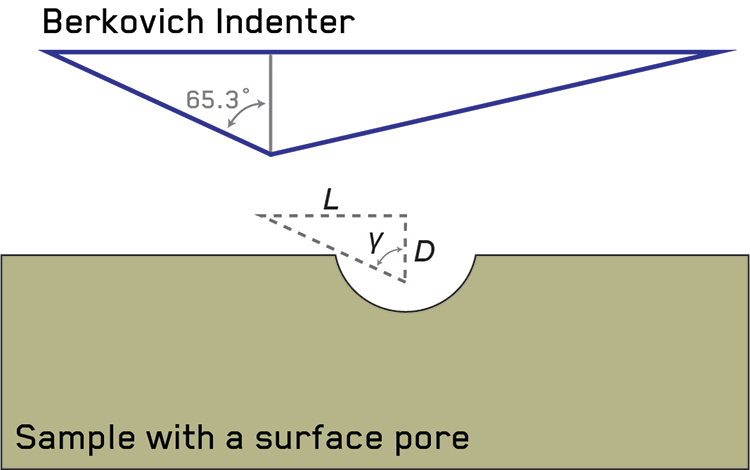
Figure 3. Schematic of the relationship between indenter facet angle, retraction distance, and inter-indent spacing step size.
Figure 3 illustrates that to determine this retraction distance, D, for a given step size, L, one must simply consider the facet angle, γ of the indenter (65.27° for Berkovich and 35.26° for Cube Corner). This face angle is the steepest angle on the indenters, and hence provides the most conservative or safest estimate for retraction distance. The required retraction distance is then , or 0.46L for Berkovich and 1.42L for Cube Corner indenters. It is important to note that relationship this only holds for displacement-controlled indentations, which only deform the material by a specified depth increment. In load-controlled indentation of a pore, the indentation depth in a pore may be very large compared to the indentation of the bulk material, so that the retraction distance must be much greater for safety to allow for the difference.
Results
Laser Powder Bed Fusion (LPBF)
As it is one of the most popular AM techniques, we will start with the results from the LPBF deposition method - Figure 4.
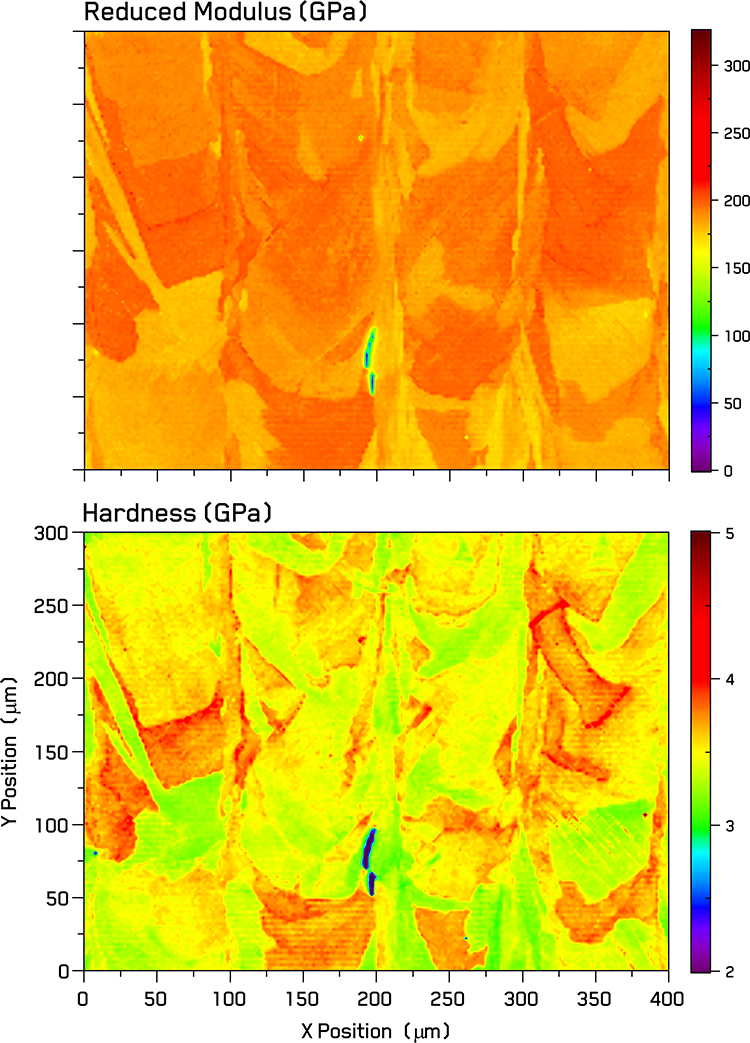
Figure 4. Indentation property maps over a cross section of the LPBF AM steel.
This mapped region shows a cross-section of four different columns of recrystallization regions corresponding to laser spot locations. These are largely asymmetric with an increment on the order of 30 µm. The borders between these columns are demarcated by thin vertically-elongated grains and in one case some vertically-aligned pores. The spread in reduced modulus observed between the various grains indicates a mostly random crystallographic orientation within the region investigated.
Several features within each recrystallized voxel can be seen in the maps with some boundaries showing local increases in hardness, while modulus is relatively constant within each grain. A pair of small pores is observed at the columnar boundary between the two middle columns.
Directed Energy Deposition (DED)
The results of the second technique investigated, laser directed energy deposition (DED), are shown in Figure 5. This microstructure appears much more conventional than that of LPBF, with elongated grains that are oriented in the direction of the moving nozzle. The region investigated is that of an interlayer boundary between the ~250 µm thick deposited layers. A couple of ~10 µm defects can be observed, corresponding to a pore (Low H and E) and an inclusion (High H and moderate E). Within the reduced modulus map, the grains can be seen to be a fairly uniform value without much interior variation or structure, whereas the hardness map shows regular, repeating structure within many of the grains. This possibly correlates to initial subgrain formation or high dislocation density cells within the grains.
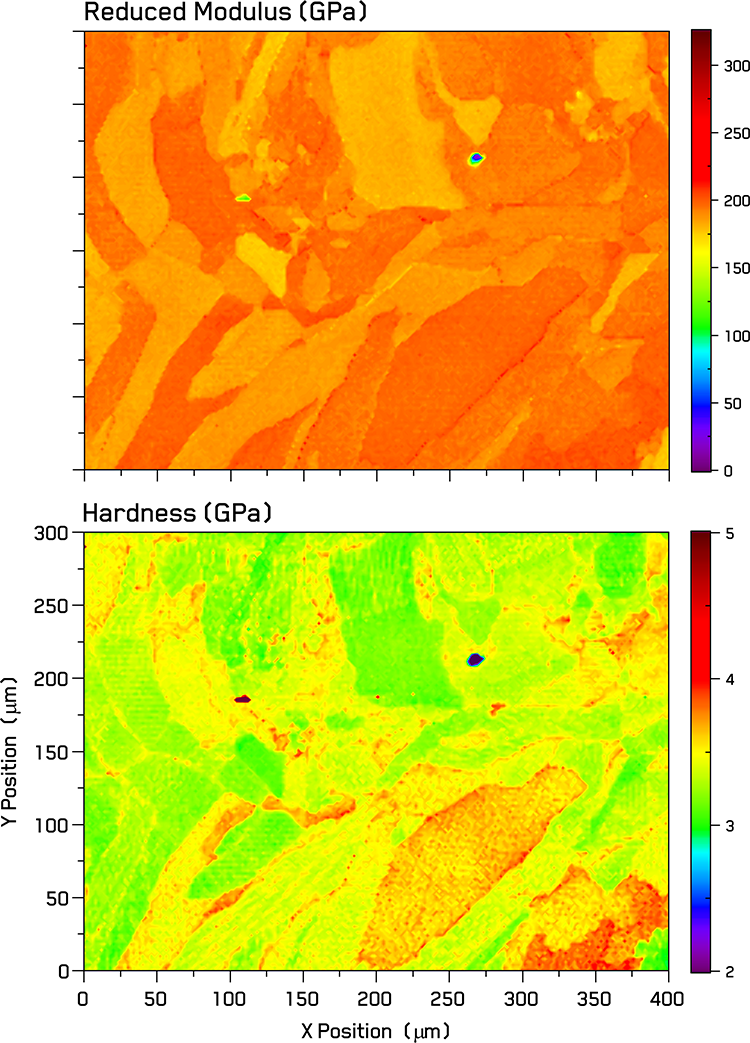
Figure 4. Indentation property maps over a cross section of the DED AM steel.
Fused Filament Fabrication of Metal
Significantly different microstructures are obtained via AM methods that utilize sintered powers. A common feature of these is porosity with regular pores from incomplete sintering, particularly at interlayer boundaries. Pores generate complex signals under displacement-controlled indentation, depending on whether a facet or a facet edge of the Berkovich indenter is in contact with the side of the pore. If the pore has rounded edges, it may be that the indenter’s first contact is a large contact of the facet on the pore sidewall, which would produce a much stiffer (i.e. high H and Er) than expected for that depth. For this reason, it is beneficial to also consider the topology map, which can be extracted from the indentation contact point, in order to exclude points which occur a higher penetration depths than the typical sample surface plane. The importance of this additional indentation parameter for analysis can be seen in Figure 6, where indentation property maps of the hardness, reduced modulus, and surface topology are shown for the FFFm steel. The grain structure of this steel is much more conventional compared to those from AM melting processes with equiaxed grains and twins clearly observed in hardness and modulus maps. Harder ferritic steel phases are also observed in several cases, as well as a significant amount of porosity.
Binder Jetting (BJ)
The utility of the topology signal for data analysis is best illustrated by results from the steel made using binder jetting - Figure 7.
This features layers of relatively large pores which remain between the layers of deposited binder after sintering. These pores typically result from a combination of several factors: gas evolution from the binder during sintering, gaps in the binder, uneven powder coverage during layers, and shrinkage during sintering. The latter of these can be seen in that the lines of pores are spaced ~50 µm, while the layers were initially 70 µm thick.
Similar to the FFFm steel, the grain structure appears conventionally well-annealed with larger, equiaxed grains and twins after the sintering process. No secondary phases are observed in this steel, unlike the FFFm. However, the pores are significantly larger. The upper portion of the pores show low values of H and Er as one might expect, but the lower portion of the pores in many cases are marked by artificially high values caused by the unusual contact situation described previously. Given this wide range of values, it is critical to have an additional parameter by which to discriminate between these porosity artefacts and valid datapoints taken on flat surfaces. For this, both the H/E and topology maps appear to be useful, but the topology map is preferred.
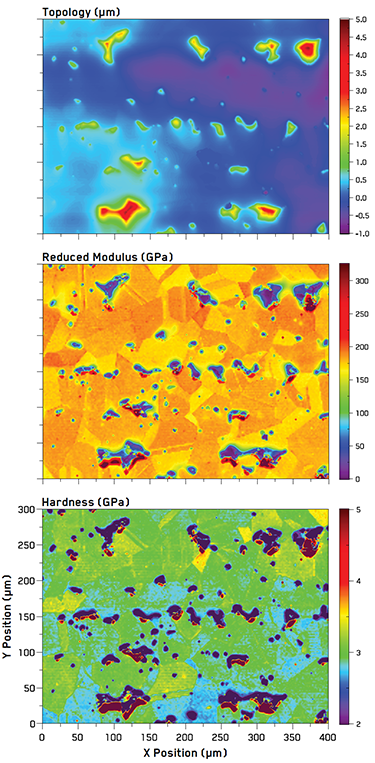
Figure 6. Indentation property maps of an 316L AM steel made using FFFm.
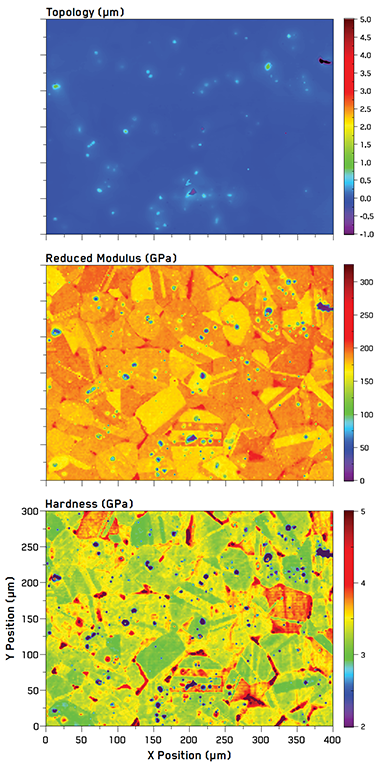
Figure 7. Indentation property maps of a cross-section of binder jetting AM steel.
Discussion
For all steel samples investigated, excellent correspondence is observed between backscattered electron micrographs and indentation maps, as shown in the hardness maps overlaid on BSE micrographs in Figure 8. Grain boundaries and porosity are seen to clearly match up with those observed with both techniques over the edges of the test region.
As hardness and elastic modulus are interrelated properties, 2D histogram plots are utilized to display the statistical distributions of the obtained H and E values over the entire mapped region simultaneously. The color of each pixel represents the number of indentations that are included within a range of H and E, which is defined as a 2D bin size. Values of only 1 indent are shown in light gray to minimize the visual impact of outliers, and higher indentation numbers are shown with a shaded gradient from darker red tones to yellow-white peaks at the highest values in each histogram.
These are therefore arbitrary units, depending on the number of total indentations performed. In this study, 30,000 indentations were performed on samples from each AM method, so typical peak values for the histograms are between 30-50 indentations. These figures offer a simple visual method to evaluate ‘hot spots’ in the indentation property space which statistically correspond to individual phases. As shown in previous work [5], these ‘peaks’ in the 2D histograms often take the form of elliptical, normal distributions which are elongated along the direction of the H/E ratio. In this case, with the exception of the FFFm sample, all samples are single phase, so the secondary peaks correspond to crystallographic texture effects.
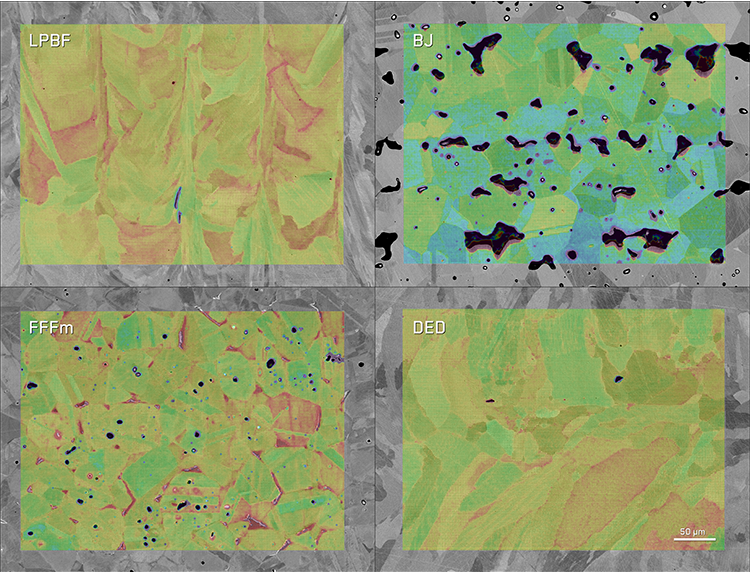
Figure 8. Backscattered electron (BSE) micrographs of the indented regions of the AM steel samples with hardness maps overlaid to illustrate the correlation between mechanical properties and electron microscopy.
Despite being Austenitic with an FCC crystal structure, 316L stainless steel is still elastically anisotropic [6]. Its elastic modulus values range from 101.6 GPa for the soft [100] orientation to 285.1 GPa for the hard [111] orientation. However, this is not the range of modulus that we measure with indentation. Instead, due to the complex stress state beneath the indenter tip, a reduced spread in modulus is measured. Through extensive finite element modelling, Vlassak and Nix [7] worked out a relationship for this effect. Applying their equation with our elastic tensor values for 316L Steel gives the following range of reduced modulus (Er) values: [100] orientation = 162.7 GPa [111] orientation = 185.6 GPa. This is in good agreement with the range of values observed in the 2D histograms in Figure 9.
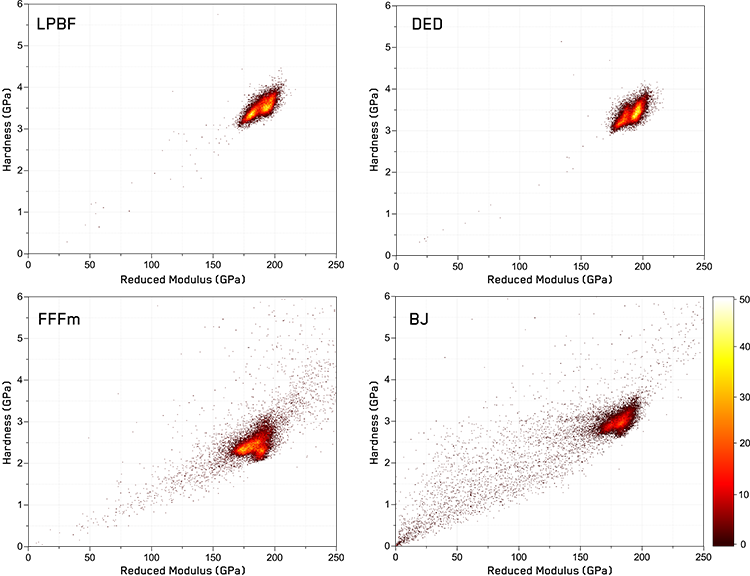
Figure 9. 2D histograms illustrating the distribution of indentation properties for each of the AM techniques.
To acquire mean values for hardness and reduced modulus, it is important to remove the influence of porosity from the data. This can be seen in the 2D histograms of the FFFm and BJ samples as diffuse clouds of datapoints between the main cluster and the origin. A simple measure of the porosity can be made by either thresholding the values a certain level of deviation from the main cluster, or by using the topology signals shown in Figure 6 and Figure 7. From these, a height threshold can be applied to exclude any datapoints below a certain penetration depth from the analysis. This fraction of the data then gives an areal fraction of the porosity - Table 1. With this influence excluded, mean and standard deviations for the main phase are straightforward to determine. These are given in Table 1. Overall hardness trends agree with the level of heat treatment experienced by the materials with sintered structures being softer. Modulus values are slightly higher than expected from Vlassak and Nix estimates, indicating that a small degree of pile-up is likely to have occurred around the indentations, elevating the apparent modulus.
Table 1. Mechanical properties extracted from cluster analysis of each sample.
|
Sample
|
Hardness
(GPa)
|
Reduced
Modulus (GPa)
|
Porosity (%)
|
|
Mean
|
SD
|
Mean
|
SD
|
--
|
|
LPBF
|
3.60
|
0.174
|
188.3
|
7.3
|
0.3
|
|
DED
|
3.46
|
0.180
|
190.5
|
6.7
|
0.1
|
|
FFFm
|
3.42
|
0.433
|
184.2
|
10.2
|
1.6
|
|
BJ
|
2.98
|
0.165
|
180.5
|
7.6
|
15.4
|
Conclusion
In this application note, 316L stainless steel samples manufactured by laser powder bed fusion, direct energy deposition, fused filament fabrication of metal and binder jetting were investigated using the same indentation mapping parameters to perform mechanical microscopy. This successfully resolved the microstructures resulting from each AM technique, in excellent agreement with backscattered electron micrographs, even on samples with large pores. This is only possible using an indentation system with a combination of high sensitivity and displacement control to tolerate surface features. This allowed porosity not only to be tolerated without damage to the indenter tip or system, but allowed direct quantification of porosity through topology measurement. Of the AM steels, samples manufactured by LPBF were found to be the hardest, while samples manufactured by sintering methods were the softest and most porous. Reduced modulus distributions correspond well with expected elastic anisotropy in 316L stainless steels.
Acknowledgements
We are grateful for the contributions from the various research groups that supplied samples of additively-manufactured material. The L-PBF sample was supplied by B. Neirinck of Aerosint and P. Zehnder, L. Deillon, M. Tucker in the group of Prof. Markus Bambach in the Advanced Manufacturing Laboratory of ETH Zurich. The DED sample was provided by L. He in the group of Prof. Mostafa Hassani at Cornell University. Special thanks is due to M. Wagner and Prof. Ralph Spolenak in the Laboratory for Nanometallurgy at ETH Zurich, as Dr. Wagner not only provided the FFFm sample but also performed the metallographic preparation of all AM samples. The BJ sample was provided by T. Tancogne-Dejean and Prof. Dirk Mohr of the Institute of Virtual Manufacturing at ETH Zurich.
References
- M.A. Wagner, A. Hadian, T. Sebastian, F. Clemens, T. Schweizer, M. Rodriguez-Arbaizar, E. Carreño-Morelli, R. Spolenak, Additive
Manufacturing, 49 (2022) 102472.
- T. Tancogne-Dejean, C.C. Roth, D. Mohr, International Journal of Mechanical Sciences, 207 (2021) 106647.
- W.C. Oliver, G.M. Pharr, Journal of Materials Research, 7 (1992) 1564-1583.
- M.J. Cordill, M.S. Lund, J. Parker, C. Leighton, A.K. Nair, D. Farkas, N.R. Moody, W.W. Gerberich, International Journal of
Plasticity, 25 (2009) 2045-2058.
- J.M. Wheeler, Journal of Materials Research, 36 (2021) 94-104.
- H.M. Ledbetter, physica status solidi (a), 85 (1984) 89-96.
- J.J. Vlassak, W.D. Nix, J. Mech. Phys. Solids, 42 (1994) 1223-1245.

