Nanoindentation testing with continuous stiffness measurement (CSM) provides a rapid, local method for investigating mechanical properties as a function of penetration depth. This is frequently accomplished by a fixed displacement amplitude of 2 nm. However, at small depths this amplitude can impose large effects on the measurement due to its relative magnitude. In this application note, we explore the relationship between oscillation amplitudes with fixed amplitudes in load and displacement, and we demonstrate that proportionally-scaled amplitude ratio CSM modes provide superior results over all depths.
Introduction
One of the major advancements during the development of nanoindentation was the advent of the continuous stiffness measurement (CSM) technique [1]. This allowed the stiffness of the contact to be determined continuously as a function of penetration depth using a superimposed dynamic oscillation. This provides a plethora of stiffness (and from this hardness and reduced modulus) datapoints for each indentation, rather than a single stiffness value from a quasi-static unloading. This greatly enhanced the speed and power of the nanoindentation technique and was widely adopted [2].
As the CSM technique was applied in a wider range of conditions on different materials, a couple issues with the technique became apparent. At shallow depths, the oscillation amplitude became relatively large and imposed a strong local fatigue effect – changing the material behavior [3, 4]. This effect was pronounced on annealed, soft metals, whose initial dislocation nucleation behavior was overshadowed and changed by the “nano-jackhammer” of the CSM oscillation. Significant errors were also noticed in large E/H ratio materials, whose high contact stiffnesses lead to errors in unloading [5]. At higher testing speeds, plasticity error (deviation from elastic oscillation due to plastic deformation) was also observed to cause overestimation of the contact stiffness [6, 7], limiting application to indentation strain rates below 0.1/s.
In this application note, we discuss the influence of CSM oscillations on nanoindentation results. This is accomplished by varying the nature and magnitude of the oscillation amplitude using both constant and proportionally varied amplitudes in both load and displacement control. This both illustrates the types of errors related to relatively large oscillations and provides a best practice guide for achieving high sensitivity results.
Methods and Materials
Nanoindentation
Nanoindentation testing was performed using an i04 Femto-Indenter with a FT-S20,000 sensor fitted with a Berkovich diamond tip. To demonstrate the effects of different oscillation amplitude parameters, CSM indentations were performed on a fused silica sample to a maximum load of 20 mN in a variety of control modes and oscillation settings. Testing time was kept constant between these variations at 50 s per indentation, which resulted in a loading rate of 40 µN/s or a displacement rate of 10 nm/s, depending on control mode. Constant amplitude tests were performed using either a force amplitude of 100 µN or a displacement amplitude of 2 nm. Proportionally-varied amplitudes were performed in both load and displacement control, as well. Displacement control amplitudes were varied from a minimum value of 0.2 nm to an increasing value determined as 2.5% of the current displacement. Force amplitudes were also proportionally varied from a minimum value of 1 µN to a value of 10% of the achieved force.
Sample preparation
Fused silica (FS) samples were acquired (Thor Labs GmbH, Lubeck, Germany) for use as a calibration reference. Reference elastic modulus, E, and Poisson’s ratio, ν, values were measured (National Physical Laboratory, Teddington, UK) according to BS EN 1389:2003 and BS EN 843-2:2006 using pulse-echo ultrasonics. Among 10 samples, values were determined to be E = 72.86 ± 0.07 GPa and ν = 0.162 ± 0.001, which according to
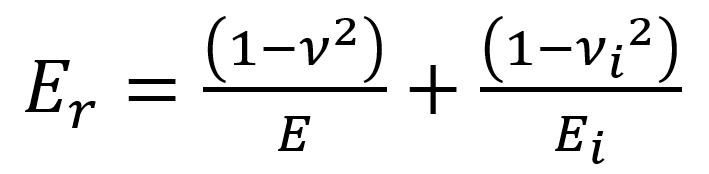 and using values for a diamond indenter (E = 1120 GPa and ν = 0.07) produces a reduced modulus value of Er = 70.24 GPa for the fused silica. These samples are used as standard references for indenter area function calibrations and as a test sample for this application note.
Results and Discussion
Conventional CSM indentation data is commonly shown in a combined plot where both the force-displacement curve and the harness and reduced modulus vs contact depth are shown. Results from the four different CSM oscillation modes are shown in Figure 1.
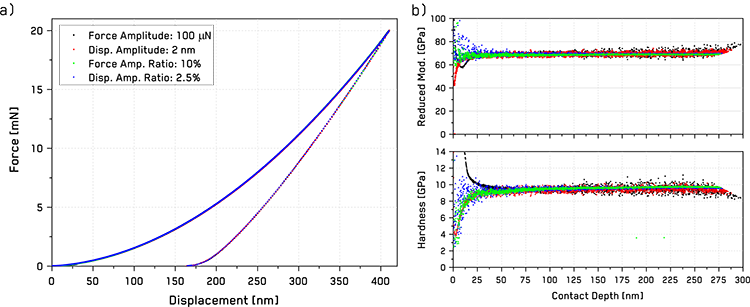
Figure 1. (a) Force-displacement curves for Berkovich indentations on fused silica and (b) resulting hardness and reduced modulus vs contact depth from indentations in four different CSM oscillation modes.
In this case, all of the different control modes produce identical force-displacement relationships. However, the hardness and reduced modulus values, while mostly consistent at H = 9.4 GPa and ER = 70.2 GPa, vary slightly between the different control modes as a function of contact depth. At higher depths, the constant amplitude tests show increasing noise compared to the test with proportional amplitude ratios. Also, at shallower depths, the different modes show markedly different curves. This is shown in greater detail in Figure 2.
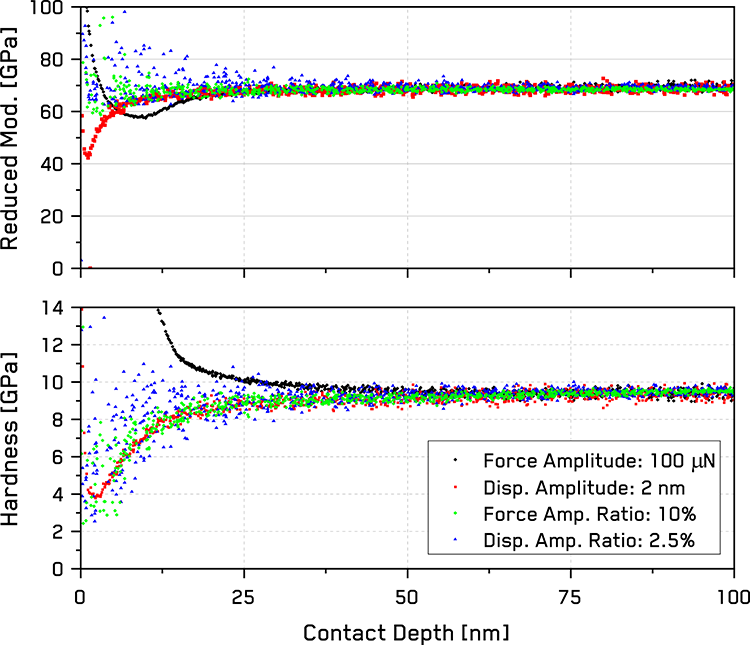 Figure 2. Hardness and reduced modulus vs contact depth from Figure 1 at low depths.
At low depths, the amplitude ratio CSM modes show nearly flat elastic moduli to extremely shallow depths, while the constant amplitude modes show more significant deviations. In hardness values, all but the constant force amplitude mode show a decreasing trend at depths </~ 25 nm corresponding to the blunting effect of this indenter tip’s radius.
In order to understand these trends, it’s instructive to examine the scale of these oscillations as a function of depth, as well as the measured contact stiffness and the relative force amplitude - Figure 3. In the lower two plots, the force amplitude and the position or displacement amplitude are shown for the four different methods. As expected, the displacement amplitude for the 2 nm constant displacement mode is uniform at 2 nm for the entire test duration. This produces a linearly increasing force amplitude with increasing depth.
In contrast, the 100 µN constant load amplitude mode shows a slight transient overshoot in force at low depths as the feedback loop establishes a stable force level. However, this coincides with a very large initial peak in position amplitude, where this 100 µN force has effectively overloaded the material at low depths. This is clearly shown by the middle plot, which shows the ratio of the force amplitude to the achieved force, FA/F. This illustrates the relative scaling of the oscillation to the load during the indentation. In the two constant amplitude modes, we see that at low depths the oscillation provides a load greater than the actual load: i.e. it provides all the loading. This is the source of the ‘nano-jackhammer’ effect [3, 4]. These values can be scaled by changing the magnitude of the force or the displacement amplitude, but the trends in behavior, especially FA/F would remain the same for any constant amplitude test. This suggests that any constant amplitude test would make some degree of overload at shallow depths.
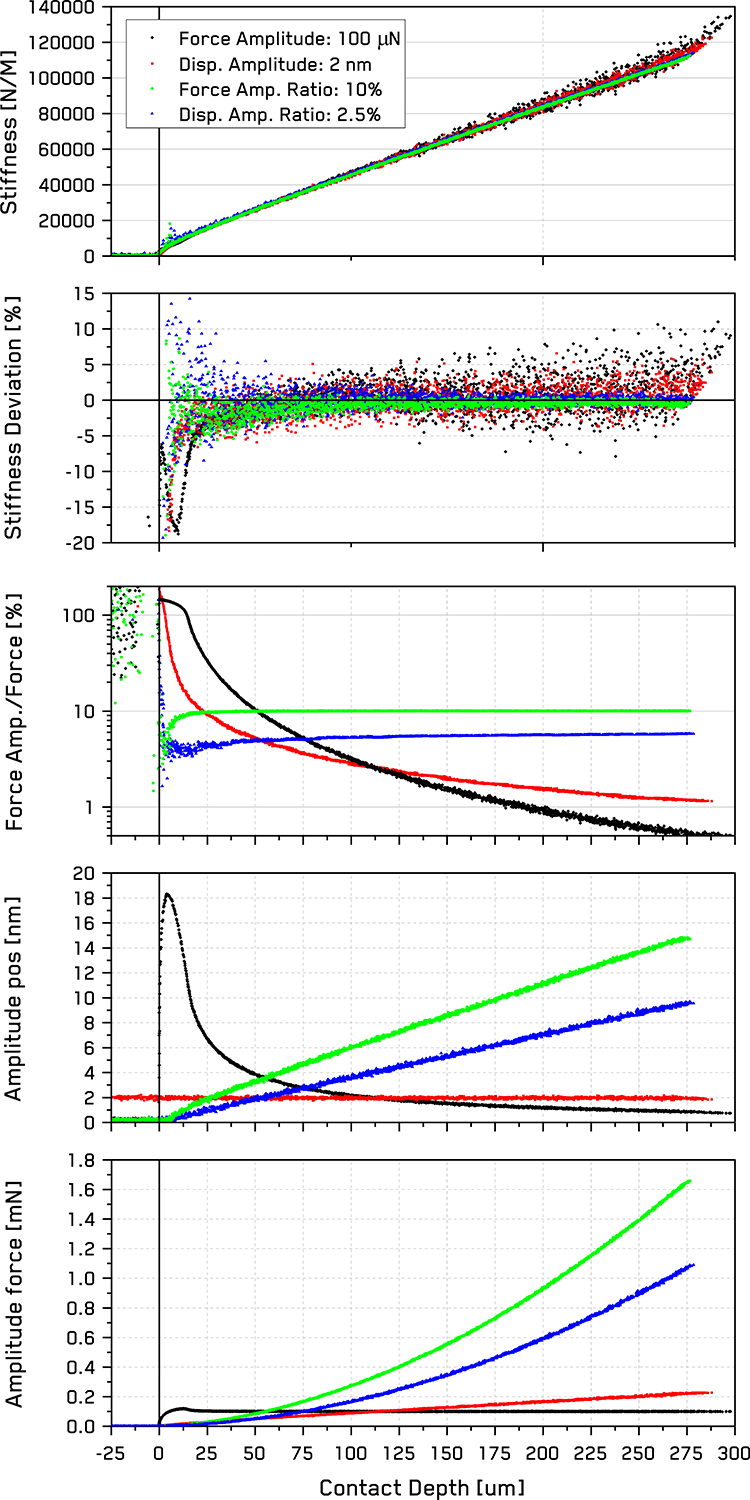
Figure 3. Amplitude parameters for various CSM oscillation modes and their resulting FA/F ratios, contact stiffness, and the deviation from the stiffness trend vs contact depth.
The situation is quite different in the two proportionally-scaled modes, where the force or displacement amplitude scales with the test. Both of these test modes produce force amplitudes that scale directly with the indentation load and displacement amplitudes that scale almost linearly with depth. This provides FA/F ratios that remain mostly constant as a function of depth. For the constant force amplitude ratio mode, this takes ~10 nm for the feedback loop to establish a constant ratio, but afterwards it remains constant over the entire test. In the constant displacement amplitude ratio mode, the FA/F achieves a constant value at even lower depths, with some scatter, and then increases slightly with increasing contact depth.
However, it is important to note that for a constant displacement amplitude ratio test, the value of FA/F achieved by a given ratio depends on the E/H ratio of the material. A given displacement amplitude ratio will produce a higher FA/F for a material with a greater E/H ratio due to the greater contact stiffness for a given depth.
This is an important consideration for nanoindentation mapping, as it implies the sensitivity of the indentation will scale with the E/H ratio of each phase. A constant force amplitude ratio test will produce a uniform FA/F for any material. However, for a natively displacement-controlled system, a constant displacement amplitude ratio is still preferred, since it avoids the necessity for a feedback loop – providing higher possible testing speeds for maps. A constant FA/F ratio test always requires a feedback loop - reducing the maximum speeds.
To discuss the sensitivity or precision of the stiffness measurement using these four different CSM oscillation modes, it’s helpful to examine the top two plots in Figure 3. These show the measured stiffness as a function of depth and the deviation from the average trend in stiffness, which illustrates the relative sensitivity of the measurement. In general, each CSM mode produces a very similar trend in stiffness. However, the stiffness deviation reveals that the precision vs depth of these different CSM modes are not equal. The constant amplitude modes, whether constant load or displacement oscillation, produce significantly more deviation over the entire depth range, and they feature the errors at low depths noted early. The proportionally-scaled modes both produce much lower deviations over the entire depth range, with the constant FA/F ratio mode showing the highest sensitivity.
Conclusion
In summary, not all CSM methods produce the same results. While the global trends are consistent between the four different oscillation modes explored in this application note, there are significant differences of which the user should be aware. CSM modes which use constant oscillation amplitudes, whether in load or displacement, produce significant overloading at shallow depths and have lower sensitivity at higher depths. It is suggested that a proportionally-scaled amplitude be used whenever possible. This maintains the scale of the oscillation with the scale of the indentation and achieves the most consistent sensitivity with depth. Force controlled amplitude ratios maintain a constant FA/F ratio with depth and high sensitivity, but they require a feedback loop which limits their maximum speeds. Displacement amplitude ratio modes produce high sensitivity results and a relatively constant FA/F ratio with depth, but the sensitivity of a given displacement amplitude ratio scales with the E/H ratio of the indented material. It is suggested that proportionally-scaled CSM amplitudes be used whenever possible to achieve the best results.
References
- D. Joslin, W.C. Oliver. Analyzing data from continuous depth-sensing microindentation tests, J Mater Res 5 (1990) 123-126.
- X. Li, B. Bhushan. A review of nanoindentation continuous stiffness measurement technique and its applications, Materials Characterization 48 (2002) 11-36.
- K.W. Siu, A.H.W. Ngan. The continuous stiffness measurement technique in nanoindentation intrinsically modifies the strength of the sample, Philos. Mag. 93 (2013) 449-467.
- M.J. Cordill, M.S. Lund, J. Parker, C. Leighton, A.K. Nair, D. Farkas, N.R. Moody, W.W. Gerberich. The Nano-Jackhammer effect in probing near-surface mechanical properties, International Journal of Plasticity 25 (2009) 2045-2058.
- G.M. Pharr, J.H. Strader, W. Oliver. Critical issues in making small-depth mechanical property measurements by nanoindentation with continuous stiffness measurement, Journal of Materials Research 24 (2009) 653-666.
- B. Merle, W.H. Higgins, G.M. Pharr. Critical issues in conducting constant strain rate nanoindentation tests at higher strain rates, Journal of Materials Research 34 (2019) 3495-3503.
- B. Merle, V. Maier-Kiener, G.M. Pharr. Influence of modulusto-hardness ratio and harmonic parameters on continuous stiffness measurement during nanoindentation, Acta Materialia 134 (2017) 167-176.

