Compositional gradients are both a useful tool for combinatorial investigations and an industrial reality in high-temperature materials where diffusion can occur at service temperatures. In this application note, a simple approach for performing correlative mechanical microscopy using nanoindentation mapping and energy-dispersive spectroscopy (EDS) is outlined and demonstrated. Using displacement-controlled indentations allowed consistent sampling from both mechanical and EDS sampled volumes. This produces paired datasets of mechanical properties and composition. This allows easy data segmentation without requiring complicated statistical deconvolution methods. Here, this is applied in a combinatorial investigation of the Ni—Ta system. Without this correlative method, phase deconvolution would have been challenging due to several phases possessing adjacent compositions and mechanical properties. This demonstrates the potential of this correlative approach for compositional gradient samples, particularly those involving complex microstructures and/or compositional variations.
Introduction
Materials with compositional gradients occur both in service conditions and by design. In service, components at high temperatures can experience diffusion of elements from internal phases, exterior coatings, or the outside environment e.g. oxygen ingress into a titanium turbine blade at high temperature [1]. By design, compositional gradients can be introduced into parts to tailor the mechanical or functional properties of individual parts of the components using additive manufacturing approaches [2].
Compositional gradients can also be used to perform combinatorial investigations over complicated compositional ranges for materials optimization and discovery using combinatorial libraries [3]. Diffusion multiples and thin films with co-sputtered gradients are popular approaches generating such libraries. However, to investigate the composition-properties relationships in these libraries, or compositional gradients in other parts, correlation between local analytical and mechanical testing techniques is required. The most popular local analytical techniques for compositional measurement are energy-dispersive X-ray spectroscopy (EDS) and wavelength-dispersive X-ray spectroscopy (WDS), while nanoindentation is the primary local mechanical interrogation technique.
The combination of nanoindentation and analytical electron microscopy is uniquely well-suited for such correlative investigations. Their mutual micrometric length scale allows them to locally interrogate with high spatial resolution. However, for a technique to be truly correlative, all measurements need to be mutually coincident, so that the compositional and mechanical properties of each location are known. Earlier applications of correlative microscopy with indentation have been limited to determining compositional relationships to mechanical behavior with either manually-selected individual sites (0D) or along a line (1D) by interpolation. A mapping approach (2D) offers much potential through its ability to tolerate non-linearities in composition and variations in multiple directions. Correlative techniques are very important for data analysis to identify trends between the compositional and mechanical techniques, as analysis of one technique alone may be insufficient for data segmentation or deconvolution of overlapping clusters [4].
In this application note, nanoindentation and compositional mapping are used to perform correlative mechanical microscopy in a combinatorial investigation of the Ni—Ta system [5]. To maximize the effectiveness of such an investigation, the sensitivity of both techniques must be optimized, as several phases in this system have adjacent properties and compositions. Details of the approach are described, particularly the system concerns, and the ability of the correlative approach to identify individual phases is demonstrated and discussed.
Experimental Considerations
For a system to perform this application, two factors are important to remember: Displacement control and Sensitivity. An image with pixels of different sizes is not ideal. Testing should be performed under displacement control, so that every indentation is made to the same maximum depth regardless of that phase’s properties. The measurement sensitivity is extremely important, as small compositional variations may only produce slight mechanical changes. A uniform grid of indentations is shown to facilitate subsequent, correlative EDS measurements, and procedures for testing are provided.
Displacement Control
Displacement-controlled indentation mapping is highly preferable for correlative applications. In load control, the load must be carefully chosen to ensure that the spacing is proportional to the indentation produced in the softest phase in the map - Figure 1, bottom right. Otherwise, indentations in the soft region will overlap with its neighbors. This means for indentations maps performed in load control, a significant disparity in indentations depths and spacings can be expected for maps over dissimilar phases. This is shown in Figure 1, where indentations are made across the diffusion couple in both control modes.
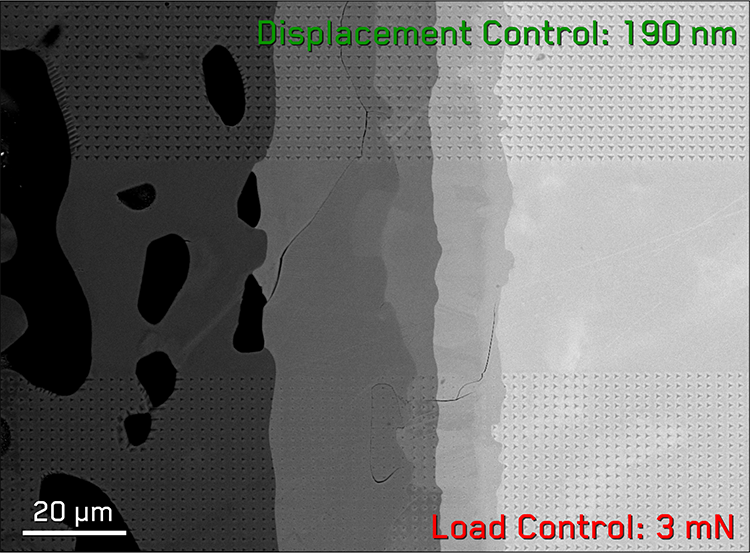
Figure 1. Grids of indentations made across the Ni-Ta diffusion junction in both load and displacement control, illustrating the inconsistent indent size in load control.
In displacement control, indentations are all performed to the same maximum depth, ensuring similar indentation sizes and regular with minor variations from differences in elastic recovery. This is important for correlative measurements, so that every mechanical and analytical measurement is taken from the same volume of material.
However, in the load controlled grid, indentations in the harder phases are much smaller than in the soft phases, so small as to be hard to visualize in the image. This renders mechanical comparisons between indentations in different phases difficult due to additional differences due to indentation size effects. This also makes correlative measurements less accurate, since the mechanical measurements no longer arise from the same sizes of material volumes as the EDS measurements. Indentation measurements in hard phases would effectively be under-sampled compared to their coincident EDS measurements.
Sensitivity
Correlated datasets from nanoindentation and EDS are not really useful unless their measurement sensitivity is high enough to resolve the variations within the mapped region. For correlative measurements, it is important to optimize both measurement techniques. Analytical techniques such as EDS should be optimized in terms of their beam spot sizes, currents, and dwell times to achieve the required sensitivity. Nanoindentation measurements can be optimized in terms of their stiffness measurement technique.
Nanoindentation measurements typically measure the contact stiffness either by simple, monotonic load-unloading tests or dynamic, continuous stiffness measurement (CSM) tests [6]. CSM testing allows the acquisition of many stiffness measurements to be acquired as a function of penetration depth during a single indentation. High frequency CSM measurements allow more datapoints to be acquired during a rapid indentation, which is critical for a high-throughput correlative method. It’s also important to be able to adjust the oscillation parameters to maximize the sensitivity. For soft metals, these oscillations should ideally be small relative to the indentation force and depth in order to reduce any cyclic loading effects [7]. Hard intermetallics are less susceptible to this, so higher oscillation amplitudes can be used to increase the stiffness sensitivity for measurements on these materials.
Correlation with EDS
In order to pair correlative datasets, identical sampling grids should ideally be performed. If one grid is oversampled or performed at a different resolution, then measurement time is wasted and measurement accuracy is reduced due to the required averaging or interpolation to achieve coincidence. 1:1 grid correspondence achieves the highest measurement sensitivity and efficiency for both measurement techniques.
For alignment purposes, it’s easiest to perform the nanoindentation mapping first, so that the indentation grid acts as a fiducial marker for aligning the EDS grid afterwards. This is the preferred order for correlative mechanical microscopy with EDS or WDS measurements, as the indentations do not typically change the local composition of the material. However, this is challenging for EBSD correlation, as indentations locally damage the crystal structure. This correlated approach is also suitable for elevated temperature nanoindentation mapping, provided that the sample composition remains stable within the investigated temperature range.
Experimental Procedures
To generate a combinatorial library for investigation of the Ni—Ta system, a diffusion couple was produced. Nickel and Tantalum bars (99.99%, Zhongnuo New Materials Ltd.), both of about 1 cm in length, were gently compressed at 150 MPa and subjected to 900 °C in vacuum using the Gleeble 3500 dynamic testing system. Afterward, the Ni–Ta junction was encapsulated in an argon-purged Quartz tube and annealed at 1200 °C for 168 h, followed by a water quench. The diffusion couple was then prepared using conventional metallographic methods. The sample was sectioned using an alumina cut-off wheel (Struers 50A 13), then polished using successively finer diamond abrasives, finishing with a 60 nm SiO2 particle suspension.
Mechanical microscopy was performed using a i04 Femto-Indenter with a diamond Berkovich indenter. Each indentation was conducted in ~1 s with an oscillation amplitude of 5 nm at a frequency of 140 Hz. This high amplitude increases sensitivity for the hard intermetallic phases. Total time for each indentation including repositioning was ~2.5 seconds. Each indentation was performed to a specified depth of 190 nm in the interdiffusion zone, so that a spacing of 2 µm between indentations could be used while still ensuring an indentation depth/spacing ratio of 10 was maintained [8]. This avoids any significant interaction between neighboring indents. Hardness and reduced modulus were measured as a function of depth for each location, and representative values for each were taken by averaging values from depths >150 nm. The scale of the microstructure is also important to consider. The indentation grid size and spacings were selected to provide sufficient resolution to characterize the narrower phase regions in the microstructure.
In this work, to ensure direct correspondence with subsequent EDS mapping, the indentation array size performed with the i04 was 128×100 indentations. This array size corresponds to a default size option in the EDAX TEAM software. Backscattered electron (BSE) imaging and EDS mapping was then performed using a scanning electron microscope (SEM, JSM-7100F JEOL) with an Ametek-EDAX Octane Plus detector. Maps were performed with a 1:1 point correspondence over indentation grids at an accelerating voltage of 20 kV with a relatively long dwell time of 10 ms and 16 averaged frames to reduce noise and maximize sensitivity. The indentation grid size of 256×200 µm is sufficiently small at the working distance of 10 mm to minimize spherical aberration in the SEM, while the numerical size of 128×100 points facilitates the visual placement of the EDS map on top of the indentations using a higher resolution SE micrograph of the region (shown in Figure 2).
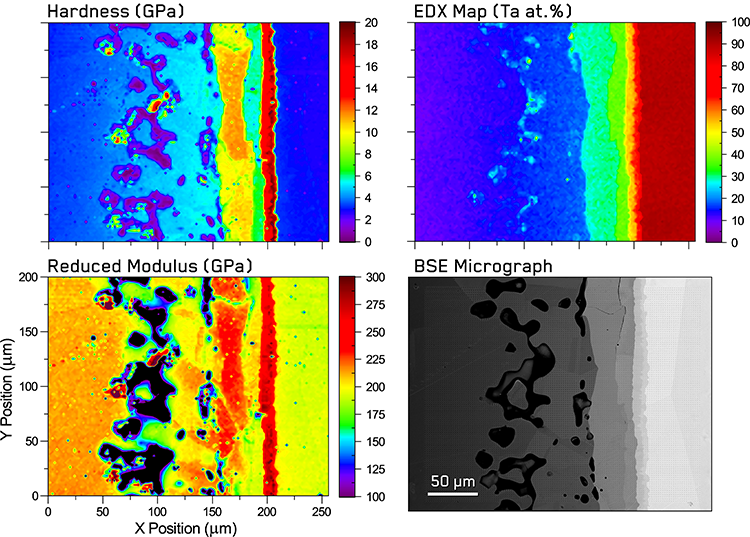
Figure 2. Indentation property maps of the interdiffusion zone of a Ni—Ta diffusion couple with corresponding EDS composition map of tantalum atomic percentage and an BSE micrograph of the indentation grid after testing..
Results
The resulting correlative mechanical and compositional maps obtained in the interdiffusion zone of the Ni—Ta couple using this method are shown in Figure 2. Excellent visual correlation is observed between the mechanical property and composition maps as well as with the BSE micrograph of the region. The maps clearly show evidence of all seven phases in the Ni—Ta system, including the five intermetallic phases.
Kirkendall porosity is observed in the region containing Nickel and Ni8Ta, which produces maxima and minima in both mechanical property maps. The reason for minima is straightforward, as indentations over the edges encounter little to no material resistance during penetration. This results in low hardness and modulus values. However, maxima can also occur if an initial contact depth is not registered until a large area of the upper portion indenter is in contact with the pore walls, providing a stiff resistance at what is incorrectly assumed by the software to be a low penetration depth. The reduced modulus also appears lower in ligaments between the porosity, which likely results from the lack of supporting material below the ligament and lack of confinement.
Moving towards the right of the maps in Figure 2, at higher Ta concentrations, four vertical stripes of alternating high and low hardness can be observed. These correspond to the Ni3Ta, Ni2Ta, NiTa & NiTa2, and Ta phases, respectively. The hardest region corresponds to both NiTa and NiTa2 phases, which do not initially appear mechanically distinct. However, their difference in composition can be clearly observed in the EDS map.
The mechanical properties of the Ni8Ta and Ni3Ta phases are also quite similar in both hardness and modulus maps. Variation in properties between different grain orientations can be easily seen in several phases, as well as local decreases in properties around cracks. This is particularly noticeable in the Hardness to Reduced Modulus (H/E) ratio map, which indicates the plastic fraction of indentation energy [9], overlaid over the indentation grid in the BSE micrograph in Figure 3.
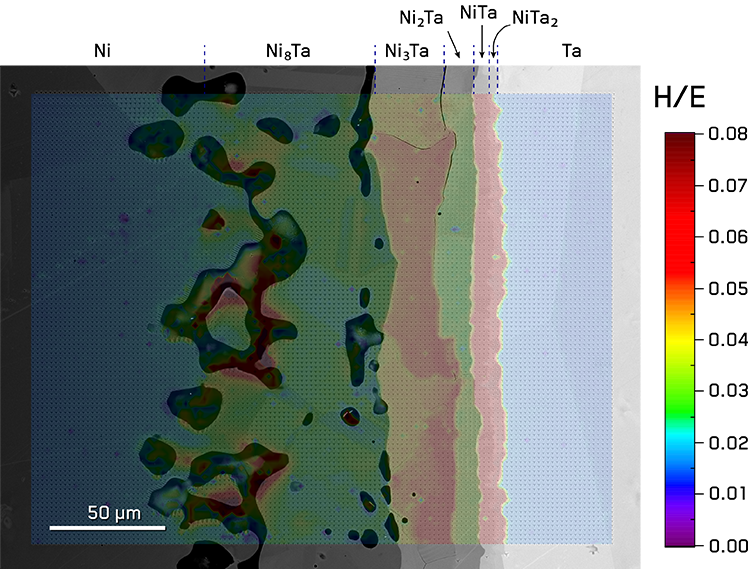
Figure 3. Overlay of H/E ratio map on BSE micrograph at 20% transparency showing the correspondence between mechanical properties and grains within the indicated phases.
The grain size in each phase can be seen to be on the order of the phase’s thickness, with Ni and Ta phases having millimeter-sized grains visible by eye and intermetallic phases being relatively smaller. Thus, this dataset provides three distinct challenges for statistical deconvolution: erroneous mechanical and analytic datapoints arising from porosity and cracks, sub-clusters from individual grains within phases, and close overlap between mechanical properties in several phases.
This overlap in mechanical properties is easily visualized using a 2D histogram - Figure 4. As demonstrated in previous work [4, 9-11], this type of plot shows the number of indentations fitting within a fixed bin of H and E values such that phases appear as clusters or peaks. In this plot, overlap in property distributions is observed between several phases. NiTa and NiTa2 phases appear as two diffuse clusters, while the Ni8Ta and Ni2Ta phases present as a collection of small clusters. The Ni and Ta phases can be easily observed as the two strongest peaks. This overlap and the presence of sub-clusters present a challenge for blind statistical deconvolution methods [4]. A large number of datapoints (~30%) corresponding to the Kirkendall porosity can be seen in Figure 4a as a tail from the Ni and Ni8Ta phases towards the origin. These datapoints can be filtered by either plotting the initial contact depth (Z-axis) on an XYZ plot and deleting datapoints which significantly deviate from the general surface topology trends or by using a threshold number of counts from the EDS dataset. By filtering out the datapoints from the Kirkendall porosity and labeling the mechanical property datapoints with the correlative EDS dataset, we can now generate the composition-labeled scatter plot displayed in Figure 4. This shows distinct clusters clearly corresponding to each phase, despite overlap in mechanical properties. NiTa and NiTa2 phases now appear separate, with NiTa showing higher modulus values whereas NiTa2 displays the highest hardness. Ni8Ta and Ni2Ta are also distinct due to their large composition difference. Ni and Ni8Ta still show an intimate overlap in data, but this is expected as the Ni phase contains a gradient of Ni8Ta precipitates.
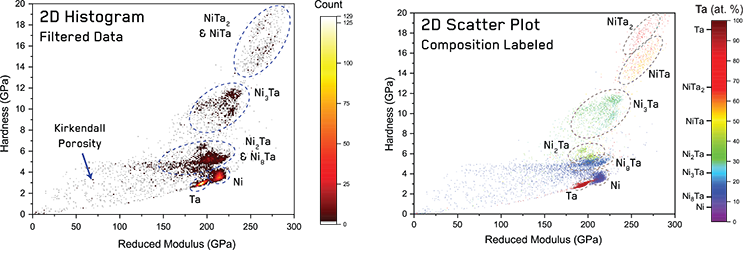
Figure 4. 2D histogram of hardness vs reduced modulus from results shown in Figure 2, and a 2D scatter plot of hardness vs reduced modulus from filtered results with datapoints color coded using EDS data with stoichiometric compositions of intermetallic phases indicated..
The mechanical properties and composition ranges for each phase’s data segmented from Figure 2 are shown in Table 1 with the number of datapoints, N, evaluated for each phase. Hardness values for the Nickel phase are rather high, 3.58 GPa. This indicates a high volume of hard Ni8Ta precipitates, which is consistent with the measured composition being above the solid-solution limit of ~7 atomic %. The hardness of Tantalum, 2.9 GPa, is quite close to the literature value of 2.99 GPa [12]. Little experimental data is available in the literature for most of the intermetallic phases. Hardness values are only available for the Ni3Ta phase [13], where a bulk Vickers hardness of 5.3 GPa was measured along with a noticeable size effect. This size effect is possibly responsible for the disparity between their value and ours.
Discussion
The high degree of data segmentation achieved in Figure 4 through correlated high-speed nanoindentation and EDS allows easy statistical analysis of each phase. However, one might claim that similar segmentation could be performed from Figure 2 by considering the order of the phases and partitioning the data by lateral position. Indeed, this is straightforward for the cases of Ni8Ta and Ni2Ta, due to the large difference in properties of the intervening Ni3Ta phase. However, deconvolution of the neighboring Ni and Ni8Ta phases and the NiTa and NiTa2 phases would still present a significant challenge.
Despite the lack of experimental values for comparison, density functional theory (DFT) calculations for elastic parameters for the Ni—Ta system do exist [14]. Using the method of Tian et al. [15], the hardness of the intermetallic phases can be calculated from the elastic constants:
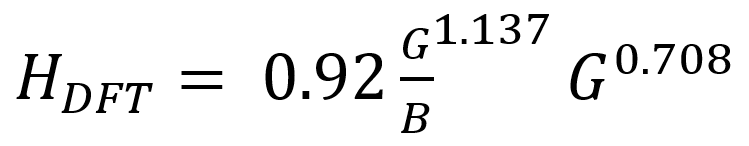 where G is the shear modulus and B is the bulk modulus. Hardness values derived using this relation, HDFT, are shown in Table 1. In general, good agreement is observed, with measured values generally higher due to size effects. Differences are typically within 1-2 measured standard deviations (SD). This variance may be also partially attributed to crystal anisotropy from an insufficient number of crystallographic orientations being investigated or to variations from using Reuss, Voigt, or Hill approximations for G in calculation. However, the HDFT values for NiTa2 are incompatible with experimental measurements, as such low values would generate clear contrast with neighboring phases (NiTa & Ta) in the hardness map.
To discuss elastic modulus values, the effect of Poisson’s ratio, ν, on measurements must first be mentioned. Unlike in previous work [9], the measured reduced modulus during indentation maps are not corrected for Poisson’s ratio, since this is not known for each phase prior to mapping. After phase segmentation, if the Poisson’s ratio for each phase is known, it is possible to correct the elastic modulus using the reduced modulus equation [7,8]:
![E = (1 - ν2) [(1 / Er* )+ (1 - νi2) / Ei )]−1](https://www.oxinst.com/learning/uploads/inline-images/ni-an4-eq2-20250527142245.png) where E is the Young’s modulus of the material, is the reduced modulus, and ν and νi are the Poisson’s ratio of the sample and the indenter tip, respectively. As Poisson’s ratios for the phases are available from DFT calculations [14], we have used these to subsequently determine the Young’s modulus of each phase from the measured values - Table 1.
where E is the Young’s modulus of the material, is the reduced modulus, and ν and νi are the Poisson’s ratio of the sample and the indenter tip, respectively. As Poisson’s ratios for the phases are available from DFT calculations [14], we have used these to subsequently determine the Young’s modulus of each phase from the measured values - Table 1.
Comparing the measured elastic moduli with values from literature, agreement within 5-10% is seen for most phases. Exceptions to this are the pure metal phases, which experience pile-up, and the NiTa2 phase. As with HDFT values, some of this variation might be attributed to anisotropy within the grains investigated, which was observable in many cases. However, measured E values for the NiTa2 phase are double the predicted values, and measured H values exceed estimates by almost an order of magnitude. This suggests that DFT predictions [14] may have underestimated the shear modulus of the NiTa2 phase.
|
Phase
|
N
|
Hardness
(GPa)
|
Elastic Properties (GPa)
|
Composition (At. %)
|
|
EReduced
|
E
|
EDFT
|
|
νDFT
|
Lit. Range
at 1200 °C
|
Mean
|
SD
|
|
Mean
|
SD
|
HDFT
|
Mean
|
SD
|
Mean
|
-
|
|
-
|
|
Ni
|
2775
|
3.58
|
0.28
|
-
|
212.42
|
3.71
|
235.67
|
207
|
0.31
|
0-7
|
11.3
|
1.1
|
|
Ni8Ta
|
1584
|
5.11
|
0.38
|
5.92
|
204.26
|
9.15
|
219.40
|
199
|
0.34
|
11-12.5
|
17.1
|
1.2
|
|
Ni3Ta
|
1340
|
10.03
|
1.47
|
8.39
|
215.45
|
18.04
|
240.74
|
252
|
0.30
|
23-26
|
29.3
|
1.2
|
|
Ni2Ta
|
519
|
6.41
|
1.30
|
5.28
|
197.09
|
9.63
|
208.41
|
189
|
0.35
|
33-35
|
37.5
|
1.1
|
|
NiTa
|
244
|
14.88
|
1.48
|
12.58
|
261.04
|
12.31
|
312.14
|
288
|
0.28
|
50-54
|
55.0
|
1.9
|
|
NiTa2
|
211
|
17.03
|
1.88
|
2.33
|
266.73
|
16.06
|
293.49
|
144
|
0.39
|
67-70
|
65.3
|
1.6
|
|
Ta
|
2417
|
2.90
|
0.19
|
-
|
193.39
|
4.00
|
204.12
|
185
|
0.35
|
98-100
|
89.7
|
0.9
|
Conclusion
The application of correlative mechanical microscopy and EDS for the investigation of compositional gradient samples was successfully demonstrated in a combinatorial investigation of the Ni—Ta system. All seven phases were clearly resolved in the resulting maps, and the mechanical properties and composition ranges for each phase were determined. This was achieved using a simple correlation method utilizing directly overlaid data matrices to allow compositional labeling of mechanical data. Using displacement controlled indentations allowed consistent sampling from both mechanical and EDS sampled volumes. This allowed easy data segmentation without requiring complicated statistical deconvolution methods. Without this correlative method, phase deconvolution of the Ni—Ta system would have been challenging due to several phases possessing adjacent compositions and mechanical properties. This demonstrates the potential of this new correlative approach for future investigations.
Acknowledgements
Full details on this work are available in a publication in Small Methods:
Wheeler, J. M., Gan, B., & Spolenak, R. (2022). Combinatorial Investigation of the Ni–Ta System via Correlated High‐Speed Nanoindentation and EDS Mapping. Small Methods, 6(2), 2101084.
References
- H.M. Gardner, P. Gopon, C.M. Magazzeni, A. Radecka, K. Fox, D. Rugg, J. Wade, D.E.J. Armstrong, M.P. Moody, P.A.J. Bagot, Journal of Materials Research, 36 (2021) 2529-2544.
- D.C. Hofmann, J. Kolodziejska, S. Roberts, R. Otis, R.P. Dillon, J.-O. Suh, Z.-K. Liu, J.-P. Borgonia, Journal of Materials Research, 29 (2014) 1899-1910.
- J.C. Zhao, Progress in Materials Science, 51 (2006) 557-631.
- H. Besharatloo, J.M. Wheeler, Journal of Materials Research, 36 (2021) 2198-2212.
- J.M. Wheeler, B. Gan, R. Spolenak, Small Methods, 6 (2022) 2101084.
- W.C. Oliver, G.M. Pharr, Journal of Materials Research, 19 (2004) 3-20.
- M.J. Cordill, M.S. Lund, J. Parker, C. Leighton, A.K. Nair, D. Farkas, N.R. Moody, W.W. Gerberich, International Journal of Plasticity, 25 (2009) 2045-2058.
- P.S. Phani, W. Oliver, Materials & Design, 164 (2019) 107563.
- J.M. Wheeler, Journal of Materials Research, 36 (2021) 94-104.
- Y. Xiao, H. Besharatloo, B. Gan, X. Maeder, R. Spolenak, J.M. Wheeler, Journal of Alloys and Compounds, 822 (2020) 153536.
- K. Wieczerzak, J. Michler, J.M. Wheeler, S. Lech, R. Chulist, J. Czub, A. Hoser, N. Schell, P. Bała, Materials & Design, 188 (2020) 108438.
- W. Martienssen, H. Warlimont, Springer handbook of condensed matter and materials data, Springer Science & Business Media, 2006.
- A. Shuitcev, Y. Tong, L. Li, Vacuum, 160 (2019) 25-30.
- Y. Zhou, B. Wen, Y. Ma, R. Melnik, X. Liu, Journal of Solid State Chemistry, 187 (2012) 211-218.
- Y. Tian, B. Xu, Z. Zhao, International Journal of Refractory Metals and Hard Materials, 33 (2012) 93-106.
- H. Okamoto, Journal of Phase Equilibria and Diffusion, 21 (2000) 497.

