Microcompression is an exciting application that allows uniaxial stress-strain behavior to be locally measured at small scales. However, it usually requires a skilled operator to manually position the flat punch tip above each pillar separately. This limits the number of tests which can be performed in a reasonable amount of time. Automation of the testing requires both the fabrication of a large, regular array of micropillars and the precise rotational alignment of the sample array’s axes with the testing system’s positioning axes. In this application note, automated, statistical microcompression of 100 lithography silicon pillars was performed in only 20 minutes using a new rotated test array function. This allows rapid acquisition of statistical microcompression data using a range of different compression parameters: variable strain levels, strain rate jumps, etc.
Introduction
Microcompression testing is a powerful application of nanoindentation systems, which enables uniaxial compression testing of small volumes. This technique was first introduced by Uchic et al. in 2004 [1], when they utilized a nanoindenter fitted with a flat-punch indenter to compress focused ion beam (FIB) machined micropillar samples. Since its inception, microcompression testing has been applied to a wide range of materials, however its application was always limited to a relatively small number of samples/pillars due to fabrication limitations and operator requirements.
Micropillar fabrication techniques have advanced significantly in the two decades since its first demonstration. FIB microscopes now allow a variety of different ion beam sources, much lower beam currents to reduce sub-surface damage, and frequently allow automated production of arrays of samples/structures. Meso-scale structures can be fabricated using plasma FIB sources or femtosecond pulsed lasers [2]. Alternative techniques such as lithography [3], micro-casting [4], and micro-AM (Additive Manufacturing) [5] are also now available. These new techniques allow large arrays to be fabricated, often with compositional or processing variations combinatorially included across the array.
With large arrays of micro-scale samples now available, the remaining step to allow automated statistical was simply the integration within nanoindentation/microcompression testing systems. This requires the performance of arrays of tests, automated surface find procedures, and careful alignment of the sample array to the system.
In this application note, the experimental considerations for automated microcompression testing are briefly described and discussed, particularly dealing with rotated or misaligned sample arrays. The application of automated microcompression testing of lithography Silicon micropillars is then presented and discussed in relation to literature values.
Experimental Considerations
Sample production
Silicon pillars were fabricated by modern lithography patterning combined with reactive ion etching (RIE) on -orientated Si single-crystal wafers. This resulted in an array of 3.5 µm diameter, taper-free pillars with and aspect ratio (diameter/height) of 3 and an inter-pillar spacing of 75 µm. Full details on sample production are available in previous work on these samples [3].
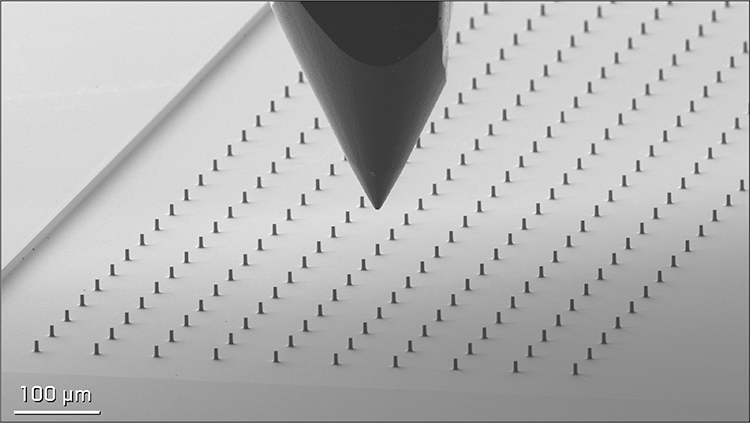 Figure 1. In situ secondary electron micrograph of deliberately misaligned Silicon pillar array.
2.2. Experimental Procedures
Microcompression testing was performed using an FT-NMT04 with an FT-S200,000 sensor fitted with a 5 µm diameter diamond flat punch. Testing was performed in situ in a Zeiss LEO 1530 SEM at an acceleration voltage of 5 kV. Displacement rates for each pillar were selected to produce a constant strain rate of 0.05/s. Engineering stress-strain behavior was calculated using the pillar’s height and diameter, and elastic pillar sink-in displacements were corrected using the procedure described in [6].
It is challenging to manually align samples during loading with an angular precision less than 1°. To allow for testing of misaligned arrays of samples, a rotated array function has been implemented in the FemtoTools software. To demonstrate this function, the sample was deliberately misaligned significantly (> 10°) during loading, as noticeable in Figure 1.
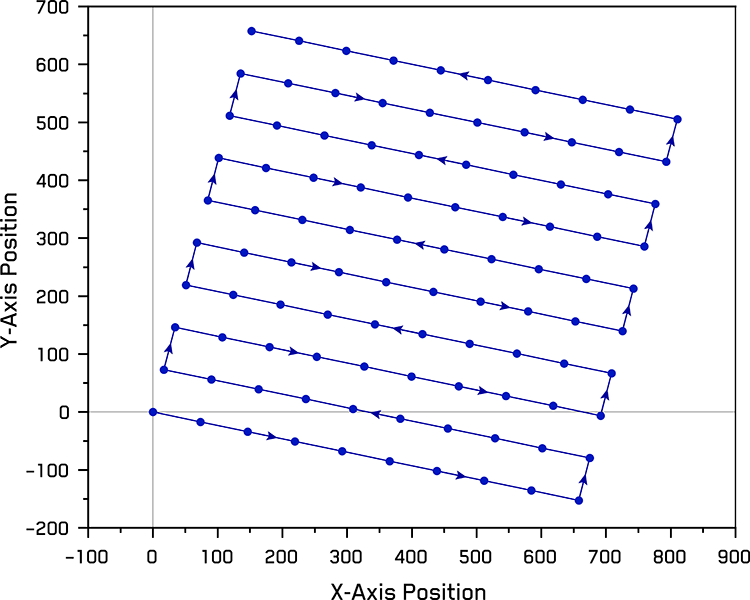 Figure 2. Illustration of rotated meander path used during automated testing of 100 Silicon micropillars.
Before performing the array of tests, the angular alignment of the array was determined by manually positioning the flat punch directly above the first and the tenth pillars to be compressed – corresponding to the bottom leftmost and rightmost pillars in the rotated 10×10 array shown in Figure 2 – and setting these as reference positions in the FemtoTools software. The software then used these reference points to determine the array’s rotation to be 13.0443°. Sample positioning was performed at a rate of 25 µm/s to facilitate video acquisition with a move back distance of 1 µm between tests. At this positioning speed and compression strain rate, the full array of 100 pillars was tested in ~20 minutes. Higher speeds are possible.
Results and Discussion
Engineering stress-strain curves from automated microcompression of 100 silicon pillars are shown in Figure 3. The Young’s modulus is seen to closely follow the expected modulus of á100ñ-oriented silicon at ambient temperature (E = 130 GPa). Small non-linearities can be observed in the initial portion of the loading curves of some tests due to debris from a previous micropillar’s failure by fracture adhering to the bottom of the flat punch. This is observed in the in situ video of the testing. This is only an issue in pillars which fail in a brittle manner and would not occur in arrays of metal or polymer pillars.
![Engineering stress-strain curves from 100 3.5 µm diameter, [100]-oriented Silicon micropillars.](https://www.oxinst.com/learning/uploads/inline-images/ni-an14-fig3-750-20250527124606.png) Figure 3. Engineering stress-strain curves from 100 3.5 µm diameter, [100]-oriented Silicon micropillars.
Figure 3. Engineering stress-strain curves from 100 3.5 µm diameter, [100]-oriented Silicon micropillars.
Very small amounts of plasticity/ductility are sometimes observed before failure in some cases. However, this is not the case for the majority of pillars, unlike previous work performed on identical pillar arrays at much lower strain rates, which saw small but consistent plasticity at this pillar diameter by dislocation glide on slip system.
Macro-scale measurements on silicon in the literature were performed at lower strain rates ( ) to prevent early fracture. However, Rabier et al. [7] demonstrated that good agreement is seen between micro- and macro-scale measurements at similar strain rates. Most micro-scale measurements are performed at higher speeds (~ ) to acquire more statistics on multiple samples. In this work, to demonstrate the high-throughput possibilities of this automated application, a higher strain rate of was employed. Faster rates are achievable but were not employed in this case to optimize the in situ video imaging conditions.
However, the primary reason for employing automated testing for brittle materials is to examine the statistical distribution of the failure/fracture stresses. This is usually accomplished via a Q-Q or a probability plot - Figure 4. This provides insight as to the failure mechanism that occurs. Additional insights can be gleaned by performing in situ micro-compression tests, which allow both stress-strain behavior and observations of deformation mechanisms to be acquired simultaneously.
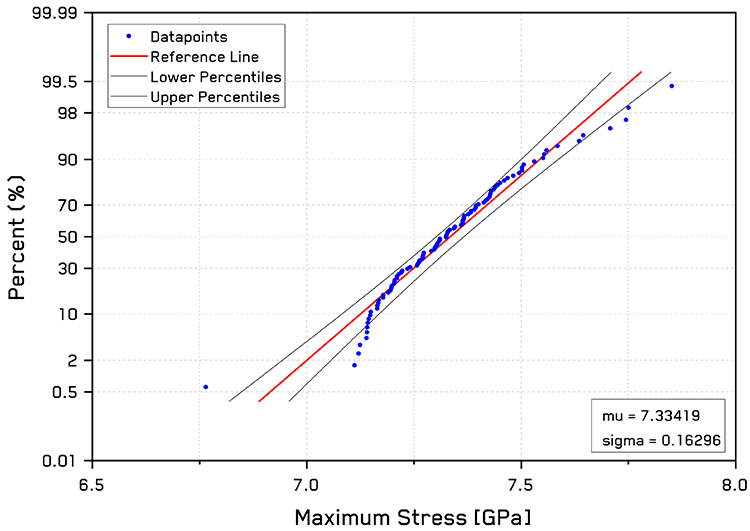 Figure 4. Normal probability plot of maximum stresses with 95% confidence bands.
Approximately ~90% of the failure stress values fall within the 95% confidence bands for a normal statistical distribution in Figure 4. A mean failure stress value (mu) of 7.33 GPa with a standard deviation (sigma) of 0.16 GPa was measured from the pillar array. This value is in good agreement with that of Chen et al. [3] performed at lower strain rates ( ) on an identical pillar array.
Some deviations from the normal distribution are observed at the high and low ends of the distribution. By consulting Figure 3, the deviations at the higher stresses can likely be attributed to some plastic behavior prior to failure. The deviant pillars at the low end of the stress values are mostly due to incomplete loading, i.e. the pillar was not deformed until failure, due to debris causing contact to be detected early, such that the pillar did not experience the designated maximum strain level. This was also observed in situ, where some pillars did not fracture upon loading.
Conclusion
In this application note, automated, statistical microcompression was performed to test a 10×10 array of 100 lithography Silicon pillars. This is a technically demanding application due to the relative positioning accuracy needed in both sample array regularity, positioning accuracy, and rotational alignment between the sample array and positioning axes. To achieve this, a rotated array function was utilized by manually positioning the system at the locations of two pillars at the lower corners in the array to determine the rotational angle of the lithographic sample array. This enabled automated testing of 100 pillars within 20 minutes. Stress-strain behavior was recorded for each pillar with elastic behavior consistent with literature values. Statistical analysis of the failure stresses of the pillars suggest that the fracture strength follows a normal distribution. This application demonstrates the feasibility of new possibilities for high-throughput, statistical, and/or combinatorial testing of micro-scale samples.
Acknowledgements
The author would like to acknowledge the assistance of C. Lauener of the Laboratory of Nanometallurgy and the Laboratory of Complex Materials for use of the Zeiss LEO 1530 FEGSEM at ETH Zürich.
References
- M.D. Uchic, D.M. Dimiduk, J.N. Florando, W.D. Nix, Science 305(5686) (2004) 986-989.
- M.J. Pfeifenberger, M. Mangang, S. Wurster, J. Reiser, A. Hohenwarter, W. Pfleging, D. Kiener, R. Pippan, Materials & Design 121 (2017) 109-118.
- M. Chen, L. Pethö, A.S. Sologubenko, H. Ma, J. Michler, R. Spolenak, J.M. Wheeler, Nature Communications 11(1) (2020) 2681.
- L. Borasi, S. Frasca, E. Charbon, A. Mortensen, Acta Materialia 249 (2023) 118817.
- A. Reiser, L. Koch, K.A. Dunn, T. Matsuura, F. Iwata, O. Fogel, Z. Kotler, N. Zhou, K. Charipar, A. Piqué, Advanced functional materials 30(28) (2020) 1910491.
- J.M. Wheeler, J. Michler, Review of Scientific Instruments 84(4) (2013) 045103.
- J. Rabier, A. Montagne, J.M. Wheeler, J.L. Demenet, J. Michler, R. Ghisleni, physica status solidi c 10(1) (2013) 11-15.

